

The latest rent report from Apartment List shows that the national average rent growth in December remained negative for the fourth consecutive month. Rents fell 0.8 percent month-over-month. Year-over-year rent growth was 3.9 percent, the lowest rate since April 2021.
Tracking rent growth trends
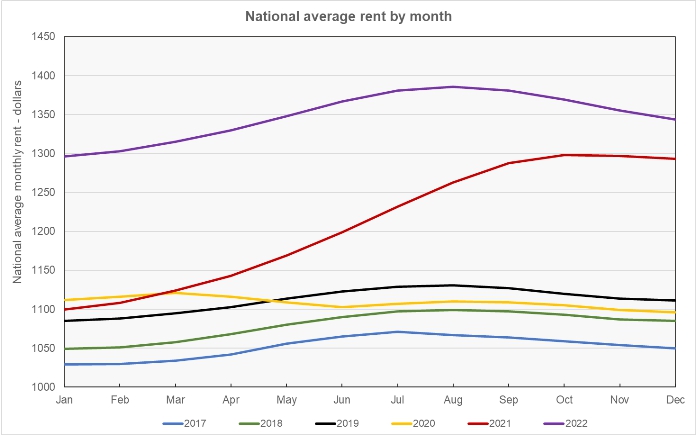
The first chart shows the history of the national average rent level since 2017. It is plotted year-by-year so that the annual change pattern is visible. The chart shows that rents in 2022 are following the seasonal pattern of the pre-pandemic years with rents peaking in late summer and then falling through the end of the year.
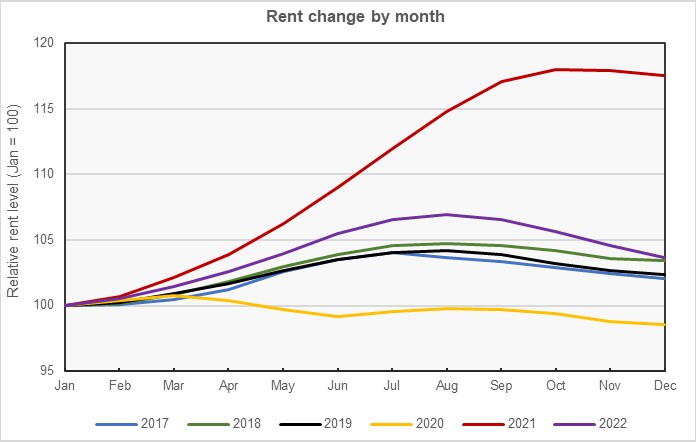
The next chart shows the rent growth since January for each year in the Apartment List data set. While rent growth early in 2022 was running ahead of that in any year other than 2021, the recent decline in rents has brought rent growth for the 2022 calendar year back into the range of growth seen in the pre-pandemic years.
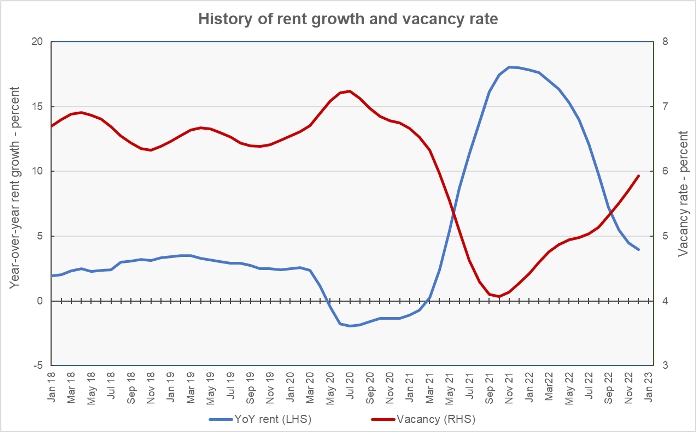
The final chart shows the year-over-year rate of rent growth since January 2018 plotted along with the national average apartment vacancy rate. It shows that both rents and vacancies are normalizing after their unusual behavior since the spring of 2020.
Leaders and trailers
Apartment List provides the underlying data they collected in compiling their report and that data was used to create the tables, below. The tables look at the 50 most populous metropolitan statistical areas defined by the US Census Bureau and identify the top and bottom 10 metros for year-over-year rent growth. The tables provide the average monthly rent in the metro, the metro’s vacancy rate, the annual percentage change in rent (YoY Metro) along with the percentage change from the prior month’s rent level (MoM Metro). They also list the percentage change in rent for the metro area compared to the rent level in February 2020, right before the pandemic struck (Feb 20).
The first table shows the 10 metros with the largest annual rent percentage increases. Only one of the top ten metros for year-over-year rent growth, Oklahoma City, saw its rents rise from November to December.
| Metro | Metro Rent | Vacancy | YoY Metro | MoM Metro | Feb 20 |
| Indianapolis | $1,180 | 5.5 | 7.4 | (0.59) | 27.7 |
| Louisville | $1,044 | 6.4 | 7.0 | (0.29) | 16.0 |
| Oklahoma City | $1,104 | 6.6 | 6.6 | 0.91 | 26.2 |
| San Jose | $2,445 | 5.3 | 6.5 | (1.81) | (0.2) |
| Chicago | $1,360 | 5.1 | 6.5 | (0.73) | 12.7 |
| Columbus | $1,229 | 4.4 | 6.5 | (0.65) | 22.3 |
| Kansas City | $1,186 | 5.6 | 6.5 | (0.67) | 18.6 |
| Cincinnati | $1,122 | 4.9 | 6.3 | (0.62) | 25.1 |
| Charlotte | $1,422 | 7.3 | 6.2 | (0.63) | 26.1 |
| San Diego | $2,327 | 4.3 | 5.6 | (1.69) | 29.1 |
The next table shows the 10 metros with the smallest annual rent increases. Many of the metros appearing in this table have historically been among the rent growth leaders.
| Metro | Metro Rent | Vacancy | YoY Metro | MoM Metro | Feb 20 |
| Las Vegas | $1,499 | 7.2 | (3.2) | (0.73) | 28.8 |
| Phoenix | $1,591 | 6.6 | (1.8) | (0.62) | 30.5 |
| Sacramento | $1,718 | 4.7 | (1.8) | (0.98) | 21.5 |
| New Orleans | $1,193 | 8.1 | (0.2) | (1.97) | 15.7 |
| Riverside | $1,908 | 4.3 | 0.0 | (0.99) | 31.9 |
| Atlanta | $1,541 | 6.1 | 0.3 | (0.96) | 26.6 |
| Detroit | $1,130 | 5.3 | 0.4 | (1.14) | 16.6 |
| Jacksonville, FL | $1,509 | 6.4 | 1.0 | (0.72) | 32.8 |
| Tampa | $1,641 | 6.3 | 1.2 | (1.32) | 37.7 |
| Baltimore | $1,611 | 4.7 | 1.3 | (0.68) | 17.7 |
The complete Apartment List report covers many more metros. It also provides readers with the opportunity to download their data sets. It can be found here.


