

Yardi Matrix reported that national average apartment rent growth stalled in January with rents remaining unchanged from December’s revised level at $1,701 per month. However, January’s preliminary rent figure is down $14 from the preliminary level reported last month.
Rent growth rates lower
The national average asking apartment rent was up 5.5 percent in January from its year-earlier level. This rate of increase was down 0.7 percentage points from that reported last month. This was the eleventh month in succession with a flat or declining rate of year-over-year rent growth.
Rents in the “lifestyle” asset class, usually Class A properties, rose 4.3 percent year-over-year, while rents in “renter by necessity” (RBN) properties increased by 7.0 percent year-over-year. Both of these rates are lower than those reported last month. The chart, below, shows the history of the year-over-year rent growth rates for these two asset classes along with the difference between these rates.
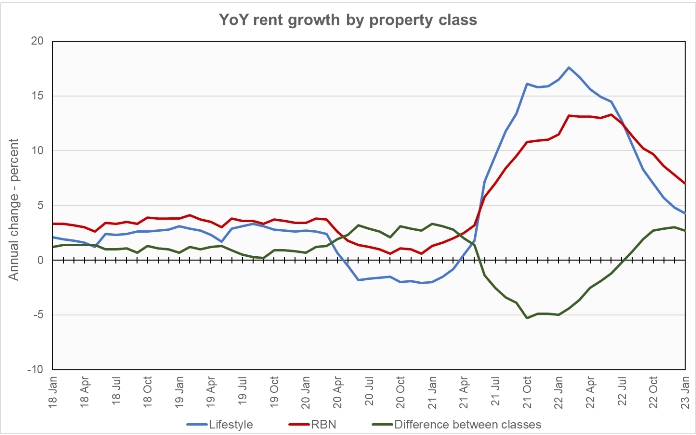
The chart shows that the year-over-year rent growth rates for these two classes of rental properties are still well above their pre-pandemic levels, but they are moving in that direction. However, the pre-pandemic years were ones of low inflation. Given the much higher rate of inflation today, it is not clear that the rent growth rates will reach the pre-pandemic levels until inflation subsides.
Year-over-year rent growth for leases that were renewed was 10.2 percent in November. The national average lease renewal rate was 61.1 percent. Yardi Matrix continues to believe that the higher rent growth rate in lease renewals is due to landlords bringing existing residents up to market rents after renewal rent growth rates were scaled down during the pandemic years.
Yardi Matrix reported that over 400,000 apartment units were delivered in 2022 while 269,000 units were absorbed. This caused the U.S. average occupancy rate to fall to 95.3 percent, 0.9 percentage points lower than its rate at the start of the year.
Yardi Matrix also reported that single-family rental (SFR) rents rose $1 in January from the revised level of the month before to $2,070 per month. The year-over-year rent growth rate fell to 4.2 percent. The national occupancy rate for single-family rentals slipped slightly from the revised level of the month before to 95.9 percent in December. Occupancy was down 1.2 percentage points from its level one year ago.
Rent growth and more
Yardi Matrix now reports on other key rental market metrics in addition to rent growth. These include the average rent to income ratio, the rent growth rate for residents who renew their leases and the portion of residents who do renew. The metro averages for rent to income ratios are included in the tables below, but the report also includes the rent to income ratios for both lifestyle and for RBN properties.
Of the top 30 metros by population, the ones with the largest annual apartment rent increases as ranked by Yardi Matrix are given in the table, below, along with their annual percentage rent changes, overall rent to income ratios, rent growth for renewed leases and renewal rates for the month. The data on asking rent growth is for January. The other data is for December.
| Metro | YoY asking rent growth % | Rent to income ratio % | YoY renewal rent growth % | Monthly lease renewal rate % |
| Indianapolis | 10.5 | 25.8 | 10.1 | 65.1 |
| San Jose | 8.1 | 25.9 | 4.1 | 49.3 |
| Miami Metro | 7.5 | 28.7 | 14.3 | 66.2 |
| Kansas City | 7.3 | 24.6 | 8.6 | 69.9 |
| Raleigh | 6.9 | 28.3 | 13.6 | 62.5 |
| Charlotte | 6.8 | 29.5 | 14.5 | 62.0 |
| Chicago | 6.7 | 28.5 | 8.0 | 61.9 |
| Dallas | 6.7 | 27.4 | 9.8 | 60.5 |
| New York | 6.7 | 32.6 | 9.6 | 58.5 |
| Portland | 6.7 | 30.9 | 9.6 | 55.3 |
The major metros with the smallest year-over-year apartment rent growth as determined by Yardi Matrix are listed in the next table, below, along with the other data as in the table above.
| Metro | YoY asking rent growth % | Rent to income ratio % | YoY renewal rent growth % | Monthly lease renewal rate % |
| Las Vegas | 0.3 | 30.7 | 12.3 | 58.9 |
| Phoenix | 0.6 | 28.6 | 13.6 | 62.0 |
| Baltimore | 2.6 | 33.3 | 9.8 | 65.6 |
| Atlanta | 2.7 | 30.4 | 9.6 | 61.7 |
| Sacramento | 2.7 | 33.2 | 7.0 | 51.6 |
| Twin Cities | 2.8 | 28.8 | 6.7 | 53.1 |
| Austin | 3.4 | 26.1 | 13.5 | 54.7 |
| San Francisco | 3.4 | 33.6 | 6.2 | 43.4 |
| Washington DC | 3.4 | 33.2 | 5.1 | 54.5 |
| Inland Empire | 3.5 | 32.4 | 10.6 | 54.8 |
The top metros for month-over month rent growth in January were Boston, Miami, Chicago and New York. Thirteen of the 30 metros tracked saw positive rent growth for the month, up from only 3 last month. The metros with the lowest month-over-month rent growth were Las Vegas, Washington D.C. and San Jose.
Expenses on the rise
The discussion section of this month’s report focused on the increases in the costs of things outside the control of apartment operators. Items mentioned include property taxes, insurance costs, financing costs and costs to harden properties against natural disasters. All are rising rapidly as the Federal Reserve’s rate hikes and the fallout from recent destructive storms work their way through the economy.
SFR sees occupancy decline
Yardi Matrix also reported on the top 34 metros for single family rentals. This month, 27 of the 34 metros covered saw positive year-over-year rent growth, matching last month’s total. The leading metros for year-over-year rent growth were Sacramento, Baltimore and Indianapolis.
This month, only 4 of the metros saw year-over-year occupancy increases. Those metros were Raleigh, Sacramento, Baltimore and Cleveland. Washington D.C, Atlanta and Seattle saw the greatest SFR occupancy declines.
Yardi Matrix noted that mortgage rates are putting a damper on single-family housing sales. However, recent mortgage rates are down about 1 percentage point from their recent highs and this may help revive the market.
Yardi Matrix data indicate that deliveries of SFR units in build-to-rent communities of 50 units or more totaled 13,800 units in 2022, a significant source of supply of new SFR units.
The complete Yardi Matrix report provides information on some of the smaller multifamily housing markets. It also has more information about the larger multifamily markets including numbers on job growth and completions of new units. It includes charts showing the history of rent changes in 18 of the top 30 markets over the last 4 years. It can be found here.


