

Yardi Matrix reported that national average apartment rent growth was flat again in February with rents remaining unchanged from January’s revised level at $1,702 per month.
Year-over-year rent growth rates sliding
The national average asking apartment rent was up 4.8 percent in February from its year-earlier level. This rate of increase was down 0.7 percentage points from that reported last month. This was the twelfth month in succession with a flat or declining rate of year-over-year rent growth.
Rents in the “lifestyle” asset class, usually Class A properties, rose 3.2 percent year-over-year, while rents in “renter by necessity” (RBN) properties increased by 6.7 percent year-over-year. Both rates are lower than those reported last month. The chart, below, shows the history of the year-over-year rent growth rates for these two asset classes along with the difference between these rates.
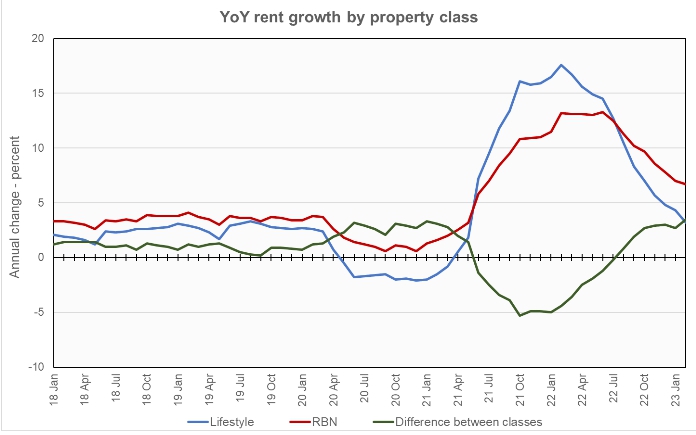
The chart shows that the year-over-year rent growth rates are moving in the direction of “normal” but they still have some distance to go. Currently, the year-over-year rent growth rate for lifestyle properties is about 30 percent higher than its average for 2018 and 2019. The rate for RBN properties is still nearly twice its average for 2018 and 2019.
Year-over-year rent growth for leases that were renewed was 8.8 percent in December. The national average lease renewal rate was 64.0 percent. Yardi Matrix suggests that lease renewal rent increases are high in order to close the gap between what current residents are paying in rent and what new renters are being asked to pay. Since growth in asking rents for new residents is slowing, rent growth for renewals is likely to also slow.
Yardi Matrix reported that 19,000 units were absorbed in January. The U.S. average occupancy rate fell to 95.2 percent, 1.0 percentage points lower than its rate at the start of the year.
Yardi Matrix also reported that single-family rental (SFR) rents were unchanged in February from the revised level of the month before at $2,071 per month. The year-over-year rent growth rate fell to 3.4 percent. The national occupancy rate for single-family rentals slipped 0.1 percentage points from the revised level of the month before to 95.7 percent in January. Occupancy was down 1.3 percentage points from its level one year ago.
Rent growth and more
Yardi Matrix reports on other key rental market metrics in addition to rent growth. These include the average rent to income ratio, the rent growth rate for residents who renew their leases and the portion of residents who do renew. The metro averages are included in the tables below, but the report also includes the rent to income ratios for both lifestyle and for RBN properties.
Of the top 30 metros by population, the ones with the largest annual apartment rent increases as ranked by Yardi Matrix are given in the table, below, along with their annual percentage rent changes, overall rent to income ratio, rent growth for renewed leases and renewal rate for the month. The data on asking rent growth is for February. The other data is for January.
| Metro | YoY asking rent growth % | Rent to income ratio % | YoY renewal rent growth % | Monthly lease renewal rate % |
| Indianapolis | 9.0 | 25.2 | 9.9 | 67.2 |
| Kansas City | 7.9 | 24.6 | 12.8 | 66.3 |
| New York | 7.0 | 29.1 | (3.5) | 59.9 |
| Chicago | 6.3 | 29.9 | 5.6 | 64.3 |
| Miami Metro | 6.3 | 27.0 | 16.8 | 70.9 |
| Boston | 6.1 | 27.9 | 10.3 | 65.8 |
| San Jose | 6.1 | 28.2 | 6.4 | 46.5 |
| Orlando | 5.8 | 33.0 | 12.3 | 67.0 |
| Portland | 5.8 | 29.7 | 7.6 | 62.1 |
| Nashville | 5.3 | 30.7 | 12.4 | 60.9 |
The major metros with the smallest year-over-year apartment rent growth as determined by Yardi Matrix are listed in the next table, below, along with the other data as in the table above.
| Metro | YoY asking rent growth % | Rent to income ratio % | YoY renewal rent growth % | Monthly lease renewal rate % |
| Las Vegas | (1.6) | 30.1 | 10.5 | 65.0 |
| Phoenix | (1.2) | 29.0 | 11.0 | 61.2 |
| Austin | 2.0 | 25.9 | 11.6 | 60.5 |
| Atlanta | 2.2 | 29.4 | 8.3 | 64.5 |
| Sacramento | 2.3 | 42.9 | 9.8 | 54.4 |
| Twin Cities | 2.9 | 29.6 | 4.3 | 61.4 |
| Baltimore | 3.0 | 32.8 | 8.8 | 64.4 |
| Orange County | 3.0 | 33.1 | 7.3 | 60.6 |
| Seattle | 3.1 | 28.5 | 9.0 | 55.2 |
| Inland Empire | 3.2 | 31.0 | 9.4 | 59.8 |
The top metros for month-over month rent growth in February were New York, Kansas City and Chicago. Nine of the 30 metros tracked saw positive rent growth for the month, down from 13 last month. The metros with the lowest month-over-month rent growth were Las Vegas, Seattle and San Jose.
Expect high rates to linger
The discussion section of this month’s report looked at the prospects for the economy and its likely impact on the multifamily business. It suggests that the persistence of high inflation will cause the Federal Reserve to raise interest rates higher for longer. The environment of high and uncertain interest rates has reduced the number of multifamily properties being sold. It will likely cause some distress for operators which may lead to buying opportunities.
SFR share fell
Yardi Matrix also reported on the top 34 metros for single family rentals. This month, 24 of the 34 metros covered saw positive year-over-year rent growth, down 3 from last month. The leading metros for year-over-year rent growth were Sacramento, Nashville and Chicago.
This month, 5 of the metros saw year-over-year occupancy increases. These metros were Sacramento, Raleigh, Orlando, Baltimore and Cleveland. Washington D.C, Indianapolis and Seattle saw the greatest SFR occupancy declines. The year-over-year occupancy decline in Washington D.C. was over 10 percent.
Yardi Matrix referred to a report that stated that, while the number of SFR units grew by 3.1 percent in the period between 2011 and 2021, their share of the overall housing inventory fell by 1.6 percent.
The complete Yardi Matrix report provides information on some of the smaller multifamily housing markets. It also has more information about the larger multifamily markets including numbers on job growth and completions of new units. It includes charts showing the history of rent changes in 18 of the top 30 markets over the last 4 years. It can be found here.


