

CoStar reported that its value-weighted index of multifamily property prices fell 7.0 percent year-over-year in February 2023. This index was down 1.4 percent month-over-month, the eighth monthly decline in a row.
The value-weighted index of non-multifamily commercial property rose by 1.9 percent, year-over-year, in February. This index rose 1.3 percent month-over-month. The other commercial property types tracked by CoStar are office, retail, industrial and hospitality. However, the individual performance of each of these categories is only reported quarterly, so that data won’t be available until CoStar reports March results next month.
For more information on the CoStar Commercial Repeat Sales Indexes (CCRSI’s), please see the section at the bottom of this report.
Comparing property types
The first chart, below, shows the history of the value-weighted CCRSI’s since January 2012 for multifamily property and for all other commercial property considered as a single asset class. It also shows trend lines for the growth in the two CCRSI’s based on their growth in the period from January 2012 to January 2020. The indexes are normalized so that their values in December 2000 are set to 100.
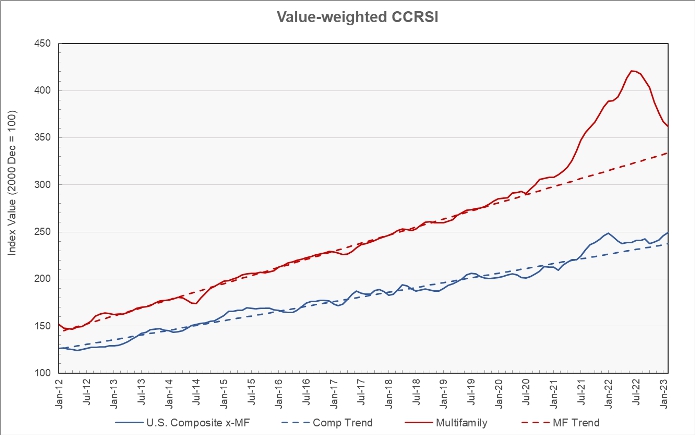
The chart shows the 8-year pattern of remarkably steady growth in the two indexes followed by the pandemic-era deviation from that pattern. The multifamily property price index is now moving in the direction of the trendline, but it is still 9 percent above trend. The price index for other commercial property did not deviate as much from the trendline during the pandemic but is now 5 percent above trend. Its deviation from the trendline has widened for 4 months in a row.
The second chart shows the year-over-year change in the value-weighted multifamily property price index and that for all other commercial property types since January 2012. It also shows the average rates of annual price growth for the two property classes over that time.
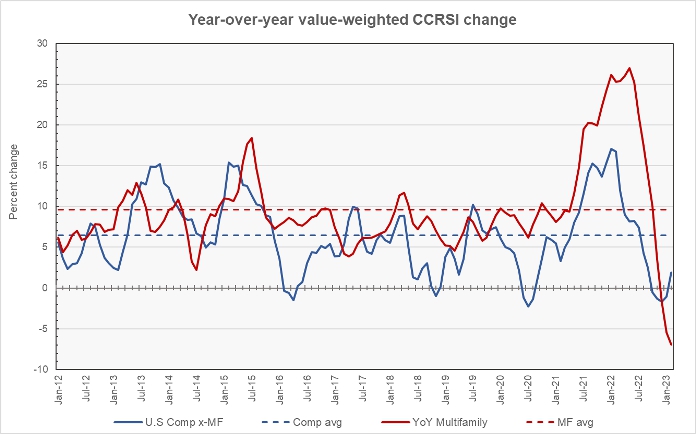
The chart shows that the gains seen in multifamily property prices during the pandemic significantly outpaced those for the other property types in the aggregate. However, the recent declines in multifamily property prices have also outpaced those for other commercial property. While the price index for non-multifamily commercial property rebounded slightly this month after four monthly declines, the multifamily property price index continued its decline.
The annual increase in multifamily property prices over the period pictured in this chart has been 9.6 percent while that of other commercial property prices has been 6.5 percent.
Transaction volumes continue to fall
An issue with monthly transaction volume reporting is that CoStar usually identifies additional transactions to tabulate over the next few months after the initial report, and these transactions can have a large influence on the results. For example, the latest report identified an additional 92 transactions for January not reported last month. This is 8 percent more transactions than contained in the initial report.
Finding more transactions after the initial report tends to overstate the level of the decline when transaction volumes are falling. For example, the fall in transactions from December to January reported last month was 38.0 percent. After identifying additional transactions for both of those months in the current report, the decline between those months is now given as 33.5 percent.
The next chart shows how the reported transaction count has varied between reports. Each cluster of bars represents a month whose transaction count is being reported. Each bar in the cluster indicates the month of the CCRSI report which contained that count value. For example, the September transaction count has been listed in the six CCRSI reports since October, while the February count has only been listed in the March CCRSI report. The chart illustrates that, while the first revision to a reported transaction count may be significant, the size of the revisions to each month’s transaction count generally declines over time.
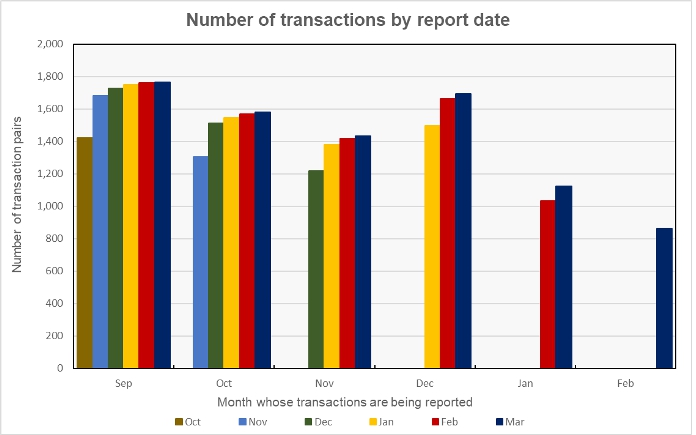
The transaction count for February was reported to fall by 23.1 percent from the revised transaction count for January contained in the current report. The 864 transactions counted in the preliminary report for February is down from the recent high of 3,814 transactions reported for the month of December 2021.
The preliminary dollar volume of transactions was also reported to fall in February, although not nearly to the degree reported for January in last month’s CCRSI report. Transaction dollar value in February was down 11.6 percent from the preliminary value reported last month and was down 13.5 precent from the revised transaction value for January reported this month.
The full report discusses all commercial property types. While the CoStar report provides information on transaction volumes, it does not break out multifamily transactions. The latest CoStar report can be found here.
CCRSI defined
The CoStar report focuses on a relative measure of property prices called the CoStar Commercial Repeat Sales Index (CCRSI). The index is computed based on the resale of properties whose earlier sales prices and sales dates are known. The index represents the relative change in the price of property over time rather than its absolute price. CoStar identified 864 repeat sale pairs in February for all property types. These sales pairs were used to calculate the results quoted here.
CoStar computes CCRSI’s for a variety of property groupings, combining them by cost, region, property type or other factors. The value-weighted index is more heavily influenced by transactions of expensive properties than is CoStar’s equal-weighted index. The value-weighted index is the focus of this report because it is an index whose value is reported monthly and for which CoStar breaks out multifamily property as a separate category.


