

The April producer price index (PPI) report from the Bureau of Labor Statistics (BLS) stated that construction materials prices were unchanged for the month, seasonally adjusted. The index of components and materials for construction was 0.8 percent higher than its year-earlier level.
Overall prices for processed goods for intermediate demand fell by 0.4 percent in the month as the price index for fuels and lubricants fell 2.3 percent. The processed goods for intermediate demand index was 3.2 percent lower than its year-earlier level.
For reference, the changes in these indices compare with a 4.9 percent rise in the all-items consumer price index (CPI-U) for the 12 months ending in April. The seasonally adjusted April CPI-U was up 0.4 percent from March’s level. The shelter portion of the CPI-U was up 0.4 percent for the month and was 8.1 percent higher than its year-ago level.
Yield Pro compiled the BLS reported changes for our standard list of construction materials prices. These are prices of materials which directly impact the cost of constructing an apartment building. The two right hand columns of the table provide the percent change in the price of the commodity from a year earlier (12 Mo PC Change) and the percent change in price from March (1 Mo PC Change). If no price data is available for a given commodity, the change is listed as N/A.
The pre-COVID column lists the change in the current construction materials prices relative to the average of prices from December 2019 through February 2020, before the pandemic impacted the economy. This may give a truer idea of the magnitude of the recent price increases for materials, such as lumber, whose prices were already rising sharply last year, than does the 12 Mo PC Change column.
| Commodity | 12 Mo PC Change | 1 Mo PC Change | Pre-covid Change |
| Softwood lumber | (38.9) | (1.2) | 21.4 |
| Hardwood lumber | (15.0) | (0.7) | 27.6 |
| General millworks | 4.1 | (0.3) | 29.9 |
| Soft plywood products | (32.7) | (0.1) | 70.5 |
| Hot rolled steel bars, plates and structural shapes | (7.9) | 1.2 | 59.4 |
| Copper wire and cable | (5.8) | (0.6) | 35.2 |
| Power wire and cable | 21.8 | 0.8 | 102.2 |
| Builder’s hardware | 4.3 | 0.1 | 25.1 |
| Plumbing fixtures and fittings | 3.5 | 0.0 | 17.6 |
| Enameled iron and metal sanitary ware | 0.5 | 0.2 | 21.5 |
| Furnaces and heaters | 11.0 | 0.5 | 35.5 |
| Sheet metal products | 1.5 | (0.2) | 44.3 |
| Electrical Lighting fixtures | 1.3 | (0.0) | 18.0 |
| Nails | (7.3) | 0.1 | 39.7 |
| Major appliances | 1.5 | 0.2 | 20.8 |
| Flat glass | N/A | N/A | N/A |
| Ready mix concrete | 12.5 | 1.0 | 27.5 |
| Asphalt roofing and siding | 4.4 | 2.3 | 35.5 |
| Gypsum products | 10.2 | (1.0) | 43.9 |
| Mineral wool insulation | 7.0 | 0.4 | 42.3 |
The first chart, below, shows the price index history for wood products over the past 37 months. Note that the prices used by the BLS in compiling the indexes are collected on the Tuesday of the week containing the 13th day of the month. In April 2022 that would have been April 11. In the May 2023 report, the data collection date will be May 9.
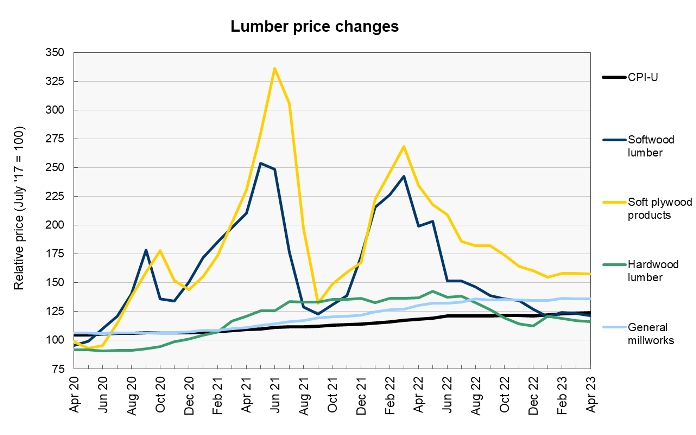
All four of the categories of wood products that we track saw their price indexes decline in April. This is true both with and without considering the revisions to the price indexes for March. While the post-pandemic rises in the price indexes for most of the wood products are now in line with those of the other construction materials that we track, the rise in the price index for soft plywood products remains the second highest of our commodities.
Markets Insider reported that the market price of lumber has been volatile, spiking higher in the middle of both March and April only to fall back at the ends of both months. It closed on April 11 at $385 and fell to $344 on May 9, but it had reached $428 in mid-April. Lumber prices in the futures markets followed a similar pattern. The May 2023 contract closed at $344 on May 9, down $41 since our last report.
The next chart, below, shows the recent history of several other construction materials prices. These are relatively simple commodities whose prices are strongly driven by those of the materials of which they are comprised.
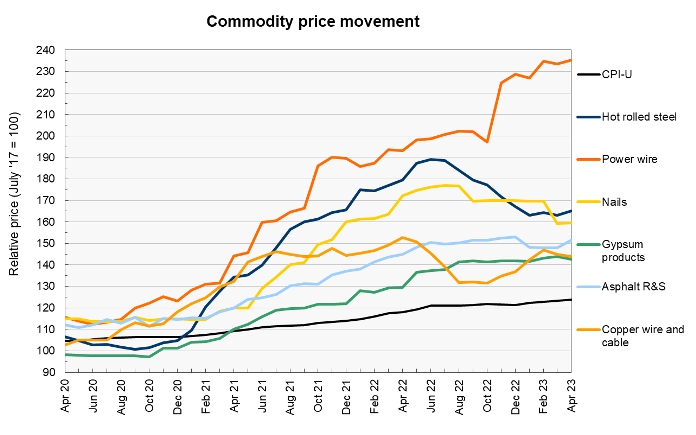
Power wire and cable, the post-pandemic price rise leader, resumed its price climb in April. Not only was its price index reported to rise for the month, but its reported price indexes for the last 4 months were also revised higher.
Hot rolled steel, number 3 on our list for post-pandemic price increases, also saw a significant monthly rise on top of upward revisions to its reported price indexes for the last 3 months. Its price index was up 2.4 percent compared to the preliminary index value for March reported last month. This was the largest such rise for any of our construction materials prices.
Asphalt roofing and siding had the largest reported monthly increase of our construction materials prices. This increase was only slightly aided by a 0.1 percent downward revision to last month’s price index.
While the price index for gypsum products was reported to fall for the month, this was due to an upward revision to the index for the prior month. The gypsum products price index for April was 0.4 percent higher than the preliminary value for March reported last month.
Looking at prices for underlying materials, MarketWatch reports that the NYSE American steel index has been trending lower since early March. It closed at $1,908 on April 11 but dropped to $1,768 in May 9, a 7 percent decline. Meanwhile, steel futures have been trending lower since spiking in mid-March. The August 2023 contract closed 7 percent lower on May 9 than its level on April 11.
The price of copper closed at $3.90 per pound on May 9, down $0.12 since April 11. However, it had closed as high as $4.12 and as low as $3.84 per pound in that time span.
The price of aluminum rose in mid-April only to fall in early May. It closed on May 9 at $2,320 up $18 from its close on April 11. It had traded as high as $2,653 in late January.
Price changes for several of the more finished goods from our sample are illustrated in the final chart, below.
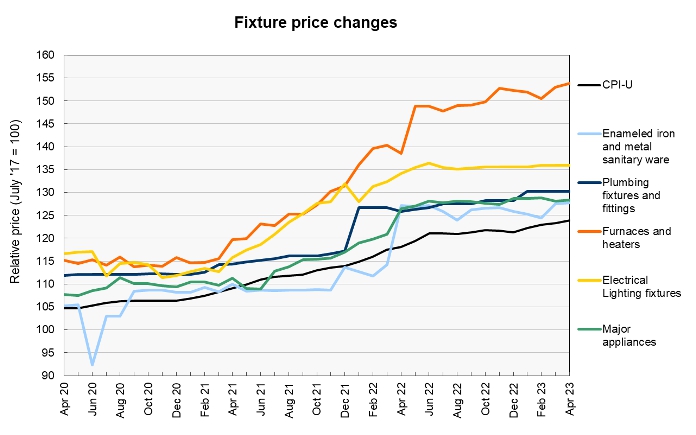
Both the preliminary March price indexes for furnaces and heaters and for major appliances were revised higher this month. On a preliminary March to preliminary April basis, the price index for furnaces and heaters was up by 1.4 percent while that for major appliances was up by 1.6 percent.
An oddity in the data is that the reported price index for plumbing fixtures and fittings has been exactly the same for four months in a row.
The full current BLS report can be found here.


