

CoStar reported that its value-weighted index of multifamily property prices fell 12.2 percent year-over-year in April. This index was down 1.4 percent month-over-month.
While last month’s report indicated that multifamily property prices had risen in March, this month’s report revised the reported 1.4 percent monthly increase to a 0.6 percent decline.
The value-weighted index of non-multifamily commercial property rose by 0.4 percent, year-over-year, in April. This index also fell 1.4 percent month-over-month. The other commercial property types tracked by CoStar are office, retail, industrial and hospitality.
For more information on the CoStar Commercial Repeat Sales Indexes (CCRSI’s), please see the section at the bottom of this report.
Multifamily lags year-over-year
The first chart, below, shows the history of the value-weighted CCRSI’s since January 2012 for multifamily property and for all other commercial property considered as a single asset class. It also shows trend lines for the growth in the two CCRSI’s based on their growth in the period from January 2012 to January 2020. The indexes are normalized so that their values in December 2000 are set to 100.
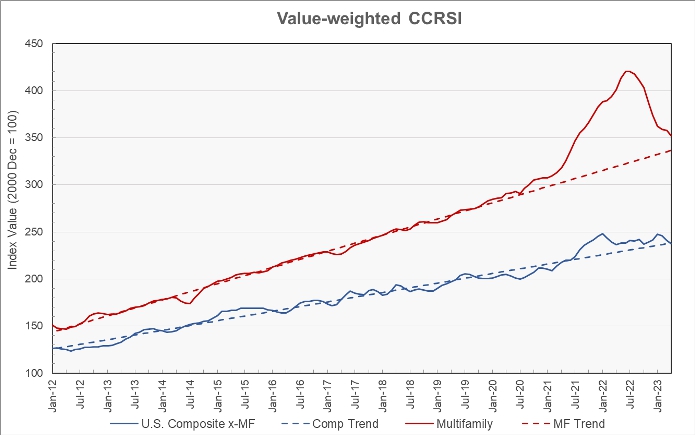
The chart shows that the multifamily index rose well above the trend line at the onset of the pandemic while the index for non-multifamily property was much less affected. The recent 9 consecutive months of multifamily property price declines has served to bring its price index closer to the long-term trend level. Currently, the multifamily property price index is 4.6 percent above the trend line while the non-multifamily property price index is 0.3 percent below the trend line.
The second chart shows the year-over-year change in the value-weighted multifamily property price index and that for all other commercial property types since January 2012. It also shows the average rates of annual price growth for the two property classes over that time.
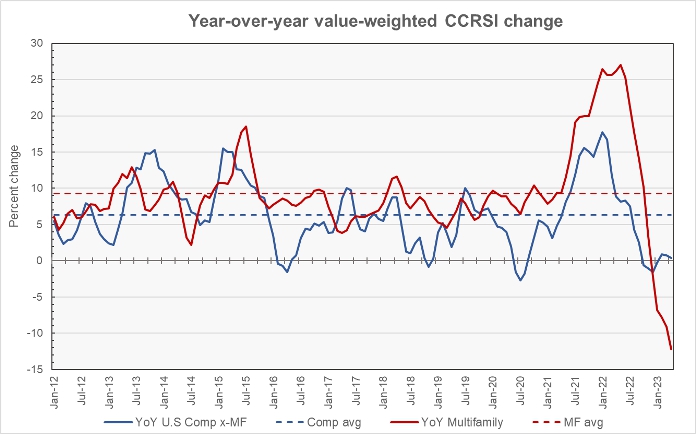
The chart shows that the year-over-year growth in multifamily property prices has been negative for the last 5 months. It is possible that this trend of negative year-over-year price growth will continue for the next several months since year-over-year comparisons will be made to a period last year when prices were very elevated. By contrast, non-multifamily commercial property prices peaked about 6 months earlier than did multifamily property prices so current year-over-year comparisons are not being made to a period with exceptionally high prices. This helped non-multifamily property prices to eke out a small year-over-year gain in April despite three consecutive months of month-over-month declines.
The average annual increase in multifamily property prices over the period shown in the chart has been 9.3 percent while that of other commercial property prices has been 6.4 percent.
Transaction volumes down sharply
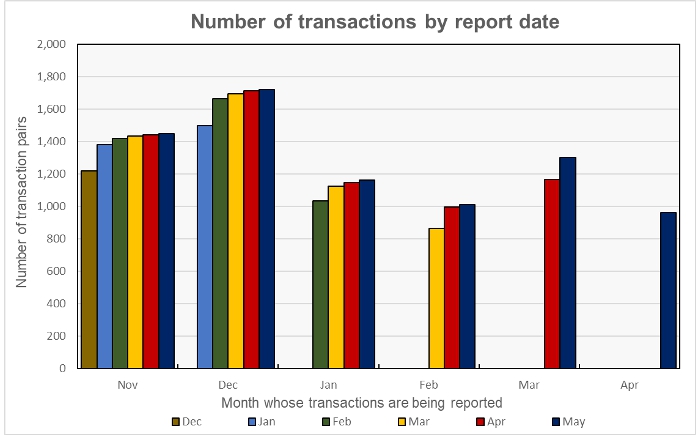
An issue with monthly transaction volume reporting is that CoStar usually identifies additional transactions to tabulate over the next few months after the initial report, and these extra transactions tend to make initial reports of declining transaction volumes worse, particularly when comparing to the revised level of the month before.
The effect of these revisions is shown in the next chart, below. The cluster of bars at the left side of the chart represent the 6 reports that have been made so far as to the volume of transactions for November 2022. The preliminary volume reported for November in December 2022 was 1,216 transactions. This count was revised to 1,379 transactions in the January 2023 report and to 1,417 transactions in the January report. The current (May) report puts the November transaction count at 1,448. The 19 percent additional transactions identified between December and May can change the assessment of how November’s transaction volume stacks up against that of any month to which it is being compared. Making comparisons based on early reports will tend to accentuate any volume decline and to attenuate any volume increase.
CoStar found that transaction volumes fell sharply during April. This was true both based on the count of the number of transactions and also based on the dollar volume of transactions.
The preliminary number of transactions reported for April was down 17 percent from the preliminary level reported for the month before. It was down 26 percent month-over-month from the revised level of the month before contained in the May report. However, the April transaction count was up 11 percent from the first transaction count reported for February and down only 7 percent from the first transaction count reported for January so the uptick in transactions in March may be more out of keeping with recent market activity than the subsequent fall in April.
The preliminary dollar volume of transactions was reported to fall 44 percent from the revised level of the month before. It was down 38 percent from the preliminary level for March reported last month.
The full report discusses all commercial property types. While the CoStar report provides information on transaction volumes, it does not break out multifamily transactions. The latest CoStar report can be found here.
CCRSI defined
The CoStar report focuses on a relative measure of property prices called the CoStar Commercial Repeat Sales Index (CCRSI). The index is computed based on the resale of properties whose earlier sales prices and sales dates are known. The index represents the relative change in the price of property over time rather than its absolute price. CoStar identified 961 repeat sale pairs in April for all property types. These sales pairs were used to calculate the results quoted here.
CoStar computes CCRSI’s for a variety of property groupings, combining them by cost, region, property type or other factors. The value-weighted index is more heavily influenced by transactions of expensive properties than is CoStar’s equal-weighted index. The value-weighted index is the focus of this report because it is an index whose value is reported monthly and for which CoStar breaks out multifamily property as a separate category.


