

The latest rent report from Apartment List shows that the national average monthly rent growth in May was a positive 0.5 percent, unchanged from last month’s increase. Year-over-year rent growth was 0.9 percent. Both of these rates are the lowest seen for the month of May in any year of the Apartment List data set other than the pandemic year of 2020. The Apartment List data set goes back to January 2017.
Apartment List reported the national average apartment rent to be $1,363.
Visualizing the data
The first chart shows the history of the national average rent level since 2017. It is plotted year-by-year so that the annual change pattern is visible. It shows that rents in 2023 remain at very high levels but that rent growth has not accelerated in late spring to the degree seen in years other than 2020.

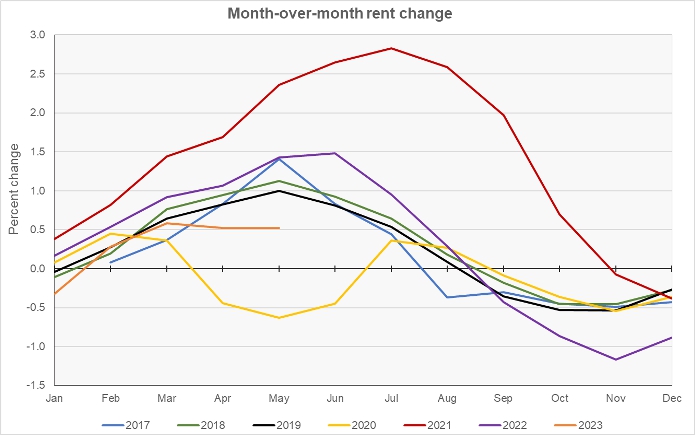
The next chart shows the month-over-month rent growth rate for the 6+ years in the Apartment List data set. The chart shows that the rent growth patterns in 2020 and 2021 deviated significantly from those in earlier years. While month-over-month rent growth in 2023 started the year off in line with the patterns of earlier years, it is now visibly lagging the growth of most of those years.
The final chart shows the year-over-year rate of rent growth since January 2018 plotted along with the national average apartment vacancy rate.
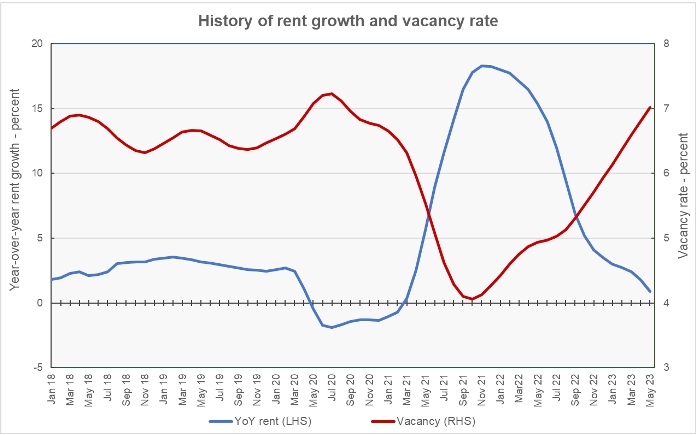
The chart shows that the current vacancy rate is 7.0 percent, slightly above the average rate of 6.6 percent for the period from January 2017 through February 2020. The vacancy rate may reach a new stable level, but the shape of the vacancy rate curve currently gives no indication that level is being approached.
The current year-over-year rent growth rate of 0.9 percent is the lowest Apartment List has seen outside of the 12 months after the COVID pandemic started to impact the economy. While it looked at the end of last year like the rent growth rate might be stabilizing around the pre-pandemic level, it has recently resumed its fall.
Leaders and trailers
Apartment List provides the underlying data they collected in compiling their report and that data was used to create the tables, below. The tables look at the 50 most populous metropolitan statistical areas defined by the US Census Bureau and identify the top and bottom 10 metros for year-over-year rent growth. The tables provide the average monthly rent in the metro, the metro’s vacancy rate, the annual percentage change in rent (YoY Metro) along with the percentage change from the prior month’s rent level (MoM Metro). They also list the percentage changes in rent for the metro areas compared to the rent levels in February 2020, right before the pandemic struck (Feb 20).
The first table shows the 10 metros with the largest annual rent percentage increases. Many of these metros are centered around midwestern cities that don’t often appear at the tops of lists for rent growth leaders.
| Metro | Metro Rent | Vacancy | YoY Metro | MoM Metro | Feb 20 |
| Cincinnati | $1,157 | 8.4 | 5.8 | 0.78 | 30.0 |
| Chicago | $1,431 | 5.4 | 5.6 | 1.35 | 18.3 |
| Louisville | $1,087 | 7.0 | 4.8 | 0.58 | 20.8 |
| Kansas City | $1,217 | 8.7 | 4.6 | 0.81 | 21.6 |
| Indianapolis | $1,204 | 6.0 | 5.4 | 0.06 | 29.0 |
| St Louis | $1,138 | 5.7 | 4.5 | 0.49 | 19.5 |
| Boston | $1,982 | 7.4 | 4.5 | 1.75 | 18.9 |
| Columbus | $1,247 | 5.2 | 4.2 | 0.37 | 24.6 |
| New York | $2,073 | 4.4 | 3.8 | 1.25 | 18.8 |
| Pittsburgh | $1,013 | 5.0 | 3.4 | 1.00 | 14.7 |
The next table shows the 10 metros with the smallest annual rent increases.
| Metro | Metro Rent | Vacancy | YoY Metro | MoM Metro | Feb 20 |
| New Orleans | $1,185 | 9.1 | (3.7) | (0.44) | 15.2 |
| Las Vegas | $1,500 | 5.4 | (3.7) | 0.25 | 29.1 |
| Phoenix | $1,574 | 5.7 | (3.8) | (0.13) | 29.2 |
| Sacramento | $1,717 | 7.7 | (3.2) | (0.23) | 21.3 |
| Riverside | $1,944 | 4.5 | (2.0) | 0.34 | 34.3 |
| Salt Lake City | $1,465 | 5.0 | (1.6) | 0.06 | 27.6 |
| Austin | $1,641 | 6.5 | (0.9) | (0.01) | 23.7 |
| San Francisco | $2,098 | 5.9 | (1.5) | 0.42 | (3.0) |
| Seattle | $1,752 | 6.3 | (0.4) | 0.57 | 11.0 |
| Tampa | $1,647 | 7.5 | (0.9) | 0.24 | 37.9 |
In May, 14 of the 50 most populous metros saw their rents decline on a year-over-year basis. Nine of the metros saw rents decline on a month-over-month basis. Only one metro, San Francisco, still has rents that are below their level in February 2020, immediately before the pandemic.
The average rent in the 10 metros with the highest rent growth is $1,355 per month, while the average rent charged in the 10 lowest rent growth metros is 22 percent higher at $1,652 per month. Cities like Phoenix, Las Vegas and Sacramento have long been on the list of cities with fast rent growth. This is how they ended up with relatively high rents. However, these cities are now rent growth laggards. It appears that now cities which had been lower down on the list of rent growth leaders are playing catch-up with the formerly high rent growth cities, causing rents across the country to move toward convergence.
The average vacancy rates for the two groups of metros are nearly the same with an average vacancy rate of 6.3 percent for the high rent growth metros compared to 6.4 percent for the low rent growth rate metros. The average rent growth since February 2020, before COVID struck, is 21.6 percent for the high rent growth metros versus 22.6 percent for the others.
The complete Apartment List report covers many more metros. It also provides readers with the opportunity to download their data sets. The latest report can be found here.


