

The latest rent report from Apartment List shows that the national average monthly rent growth in June was a positive 0.4 percent, down slightly from last month’s increase. Year-over-year rent growth was negative 0.5 percent. Since 2017, only the pandemic year of 2020 posted worse results in June.
Apartment List reported the national average apartment rent to be $1,369, up $5 from last month’s revised figure.
Charting the data
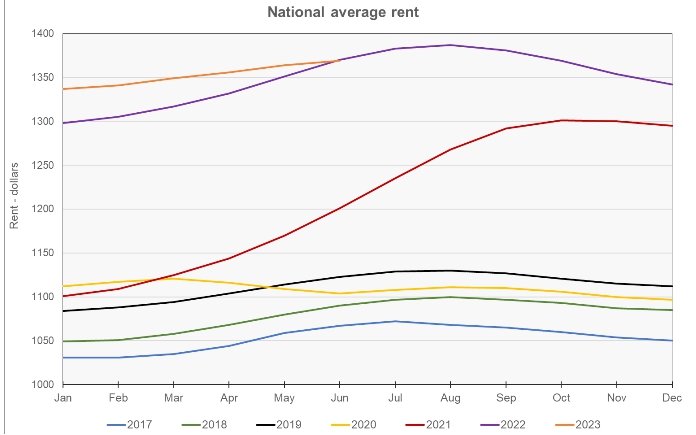
The first chart shows the history of the national average rent level since 2017. It is plotted year-by-year so that the annual change pattern is visible. It shows that rents in 2023 are now effectively at the same level as this time last year.
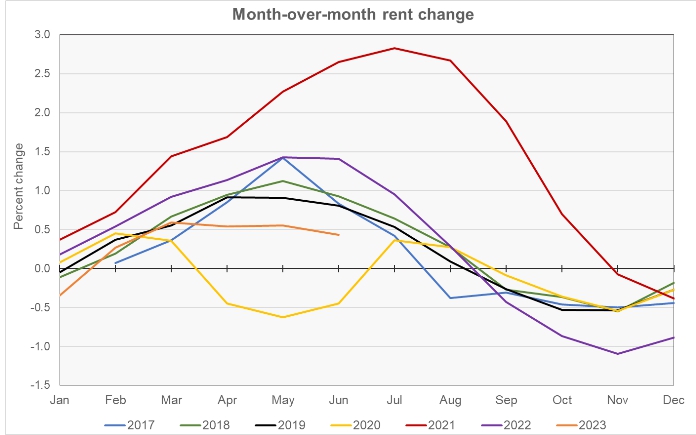
The next chart shows the month-over-month rent growth rate for the Apartment List data set. The chart shows that the month-over-month rent growth early in 2023 showed signs of rebounding from the large monthly declines that were seen at the end of 2022. However, while 2023 is following the typical pattern of rents rising month-over-month early in the year, the growth this year has been relatively anemic.
The final chart shows the year-over-year rate of rent growth since January 2018 plotted along with the national average apartment vacancy rate.
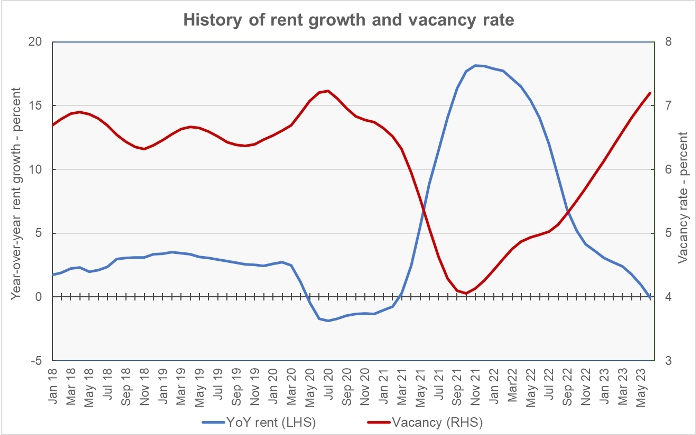
The chart shows that the current vacancy rate is 7.2 percent, up from last month’s report of 7.0 percent. The vacancy rate has risen every month since reaching a recent low in October 2021 and is now only fractionally below the high reached in July 2020.
The current year-over-year rent growth rate of -0.5 percent is the first negative rent growth reading for Apartment List since February 2021. Based on recent trends in both vacancy rate and in rent growth rate, it may not be the last.
Highs and lows
Apartment List provides the underlying data they collected in compiling their report and that data was used to create the tables, below. The tables look at the 50 most populous metropolitan statistical areas defined by the US Census Bureau and identify the top and bottom 10 metros for year-over-year rent growth. The tables provide the average monthly rent in the metro, the metro’s vacancy rate, the annual percentage change in rent (YoY Metro) along with the percentage change from the prior month’s rent level (MoM Metro). They also list the percentage changes in rent for the metro areas compared to the rent levels in February 2020, right before the pandemic struck (Feb 20).
The first table shows the 10 metros with the largest annual rent percentage increases. Many of these metros are centered around midwestern cities that, until recently, haven’t appeared at the tops of lists for rent growth leaders.
| Metro | Metro Rent | Vacancy | YoY Metro | MoM Metro | Feb 20 |
| Chicago | $1,448 | 5.8 | 4.0 | 0.91 | 19.5 |
| Kansas City | $1,236 | 9.2 | 3.7 | 1.42 | 23.4 |
| Cincinnati | $1,163 | 8.7 | 3.5 | 1.02 | 30.8 |
| St Louis | $1,147 | 6.0 | 3.5 | 0.46 | 20.6 |
| Louisville | $1,091 | 7.2 | 2.9 | 0.45 | 21.2 |
| Indianapolis | $1,201 | 6.3 | 2.5 | 0.77 | 29.7 |
| Boston | $2,011 | 7.8 | 2.3 | 1.40 | 20.5 |
| Milwaukee | $1,139 | 5.6 | 2.1 | 1.63 | 20.5 |
| New York | $2,098 | 4.7 | 1.8 | 1.29 | 20.4 |
| Virginia Beach | $1,631 | 5.5 | 1.5 | 0.40 | 29.3 |
The next table shows the 10 metros with the smallest annual rent increases.
| Metro | Metro Rent | Vacancy | YoY Metro | MoM Metro | Feb 20 |
| New Orleans | $1,178 | 8.7 | (6.7) | 0.95 | 14.8 |
| Las Vegas | $1,488 | 5.4 | (5.0) | (0.04) | 28.2 |
| Phoenix | $1,570 | 6.0 | (4.2) | (0.09) | 28.9 |
| Austin | $1,644 | 6.7 | (3.4) | (0.14) | 23.9 |
| Sacramento | $1,733 | 8.1 | (3.3) | 0.82 | 22.5 |
| Seattle | $1,771 | 6.4 | (3.2) | 0.77 | 12.2 |
| Riverside | $1,941 | 4.6 | (3.0) | 0.05 | 34.1 |
| Salt Lake City | $1,468 | 5.5 | (2.5) | 0.15 | 27.5 |
| San Francisco | $2,112 | 6.2 | (2.5) | 0.44 | (2.4) |
| Tampa | $1,646 | 8.0 | (2.4) | 0.11 | 38.1 |
In June, 27 of the 50 most populous metros saw their rents decline on a year-over-year basis. This was up from only 14 last month. However, only 5 of the metros saw rents decline on a month-over-month basis, down from 9 last month. San Francisco remains the only top-50 metro that still has rents that are below their level in February 2020, immediately before the pandemic.
The average rent in the 10 metros with the highest rent growth is $1,417 per month, while the average rent in the 10 lowest rent growth metros is 17 percent higher at $1,655 per month. Rents across the country seem to be continuing to move in the direction of convergence.
The average vacancy rates for the two groups of metros are nearly the same with an average vacancy rate of 6.7 percent for the high rent growth metros compared to 6.6 percent for the low rent growth rate metros. The average rent growth since February 2020, before COVID struck, is 23.6 percent for the high rent growth metros versus 22.8 percent for the others.
The complete Apartment List report covers many more metros. It also provides readers with the opportunity to download their data sets. The latest report can be found here.


