

The latest rent report from Apartment List shows that the national average monthly rent growth in July was 0.3 percent, down slightly from last month’s increase. Year-over-year rent growth was negative 0.7 percent. The month-over-month results are the worst for a July in the Apartment List data set, which began in 2017. The year-over-year results are worse than any July except for July 2020, shortly after COVID arrived.
Apartment List reported the national average apartment rent to be $1,369, up $3 from last month’s figure.
Visualizing the data
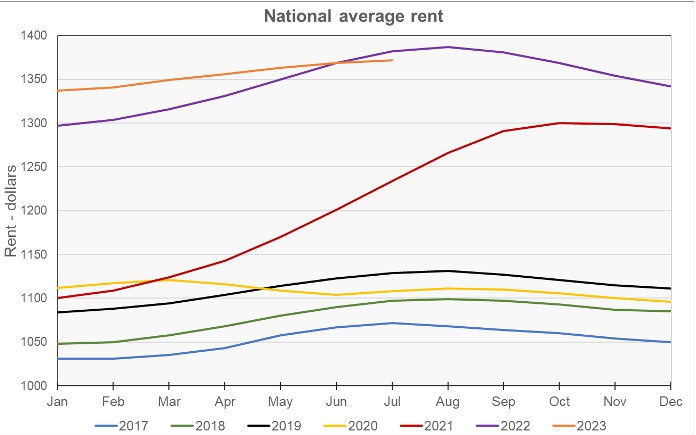
The first chart shows the history of the national average rent level since 2017. It is plotted year-by-year so that the annual change pattern is visible. It shows that rents in 2023 are now visibly lower than those of the year before, the first time that this has been true since February 2021.
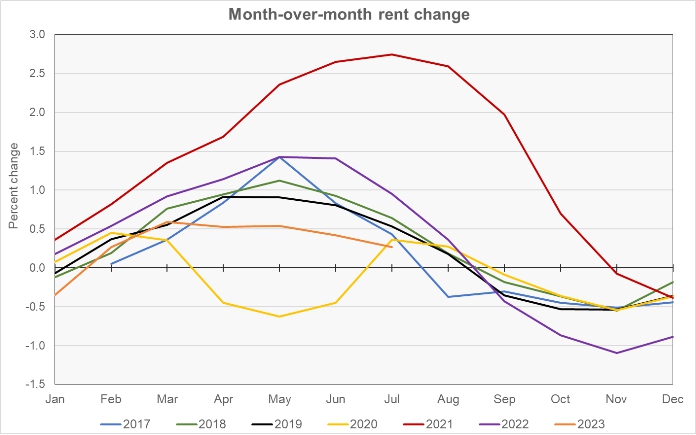
The next chart shows the month-over-month rent growth rate for the Apartment List data set. The chart shows that the rate of month-over-month rent growth started the year at a low point as a carry-over from the large rent declines seen at the end of last year. Although rent growth showed indications that it might return to pre-pandemic levels in February and March, it then fell behind the rates of growth seen in most earlier years. Month-over-month rent growth in July remains positive, as is usual for this time of year, but it is below the levels of earlier years.
The final chart shows the year-over-year rate of rent growth since January 2018 plotted along with the national average apartment vacancy rate.
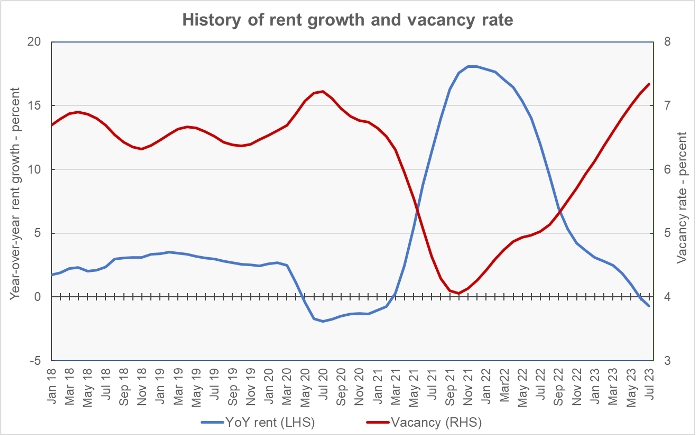
The chart shows that the current vacancy rate is 7.3 percent, the highest rate seen in the Apartment List dataset. However, the current year-over-year rent growth decline of -0.7 percent is still well above the -1.9 percent drop in rents in July 2020.
Leaders and trailers
Apartment List provides the underlying data they collected in compiling their report and that data was used to create the tables, below. The tables look at the 50 most populous metropolitan statistical areas defined by the US Census Bureau and identify the top and bottom 10 metros for year-over-year rent growth. The tables provide the average monthly rent in the metro, the metro’s vacancy rate, the annual percentage change in rent (YoY Metro) along with the percentage change from the prior month’s rent level (MoM Metro). They also list the percentage changes in rent for the metro areas compared to the rent levels in February 2020, right before the pandemic struck (Feb 20).
The first table shows the 10 metros with the largest annual rent percentage increases. Many of these metros are centered around midwestern cities that haven’t appeared at the tops of lists for rent growth leaders in recent years.
| Metro | Metro Rent | Vacancy | YoY Metro | MoM Metro | Feb 20 |
| Chicago | $1,456 | 6.7 | 3.6 | 0.67 | 20.1 |
| Kansas City | $1,244 | 7.6 | 3.3 | 0.72 | 23.9 |
| Cincinnati | $1,172 | 5.9 | 2.8 | 1.15 | 32.0 |
| Hartford | $1,541 | 6.4 | 2.5 | 1.45 | 29.5 |
| St Louis | $1,152 | 5.6 | 2.2 | 0.21 | 21.4 |
| Milwaukee | $1,108 | 8.0 | 2.1 | 0.33 | 18.2 |
| Louisville | $1,094 | 8.4 | 2.0 | 0.30 | 21.6 |
| Boston | $2,026 | 8.7 | 1.9 | 0.64 | 21.5 |
| Indianapolis | $1,205 | 4.5 | 1.3 | 0.21 | 29.8 |
| New York | $2,115 | 8.8 | 1.2 | 0.99 | 21.2 |
The next table shows the 10 metros with the smallest annual rent increases.
| Metro | Metro Rent | Vacancy | YoY Metro | MoM Metro | Feb 20 |
| New Orleans | $1,188 | 5.6 | (5.1) | 1.22 | 15.5 |
| Phoenix | $1,574 | 6.6 | (4.5) | 0.18 | 29.1 |
| Austin | $1,642 | 5.9 | (4.5) | (0.11) | 23.6 |
| Las Vegas | $1,506 | 6.2 | (4.4) | 0.20 | 29.5 |
| Seattle | $1,785 | 7.2 | (4.0) | 0.83 | 13.0 |
| Portland | $1,537 | 5.5 | (3.8) | (0.32) | 15.1 |
| Nashville | $1,467 | 5.4 | (3.6) | (0.33) | 25.6 |
| San Francisco | $2,111 | 7.3 | (3.5) | 0.17 | (2.2) |
| Jacksonville | $1,490 | 7.9 | (3.4) | (0.33) | 31.3 |
| Salt Lake City | $1,470 | 7.4 | (3.2) | 0.11 | 27.8 |
In July, 34 of the 50 most populous metros saw their rents decline on a year-over-year basis. This was up from 27 last month. In addition, 10 of the metros saw rents decline on a month-over-month basis. San Francisco remains the only top-50 metro that still has rents that are below their level in February 2020, immediately before the pandemic.
The average rent in the 10 metros with the highest rent growth is $1,411 per month, while the average rent charged in the 10 lowest rent growth metros is 12 percent higher at $1,577 per month.
The average vacancy rates for the high rent growth metros is 7.1 percent compared to 6.5 percent for the low rent growth rate metros. The average rent growth since February 2020, before COVID struck, is 23.9 percent for the high rent growth metros versus 20.8 percent for the others.
The complete Apartment List report covers many more metros. It also provides readers with the opportunity to download their data sets. The latest report can be found here.


