

The latest commercial property price report from MSCI Real Capital Analytics said that multifamily property prices in June were unchanged from their level of the month before but down 11.7 percent from their level of one year before. The year-over-year rate of decline was the largest of any of the commercial property types tracked in the report. However multifamily property prices experienced the smallest month-over-month decline of the property types tracked.
Defining CPPI
MSCI tracks an index called the Commercial Property Price Index (CPPI). The index is computed based on the resale prices of properties whose earlier sales prices and sales dates are known. The index represents the relative change in the price of property over time rather than its absolute price. Note that, as new properties are added to the MSCI dataset each month, they recalculate the CPPI all the way back to the beginning of the data series.
Property prices down again
On a month-over-month basis, suburban office properties were the best performers other than multifamily, with a price decline of only 0.2 percent. Prices for industrial property fell 0.3 percent for the month, a slight improvement on last month’s 0.5 percent decline. Retail property prices fell 0.6 percent, matching last month’s decline.
Office properties within central business districts (CBDs) experienced a price decline of only 0.5 percent. Offices in CBD’s remain the worst performing of the commercial property types tracked by MSCI over the past three-year and five-year time spans. It is the only commercial property type whose prices have declined over the last 3 years.
All property types tracked also saw price declines on a year-over-year basis. Industrial property was the best performing with a price drop of 2.8 percent. Prices for offices within CBD’s were down 7.4 percent while prices for suburban offices fell 7.3 percent. Prices for retail property were down 8.3 percent.
Apartment prices remain above trend
The first chart, below, shows how the CPPI’s for all commercial property and for apartments have changed since January 2012. To simplify the comparison, both CPPI’s have been normalized to values of 100 in January 2012. The chart also contains trend lines showing the straight-line average rates of price appreciation for the two asset classes based on their performance from January 2012 to December 2019.
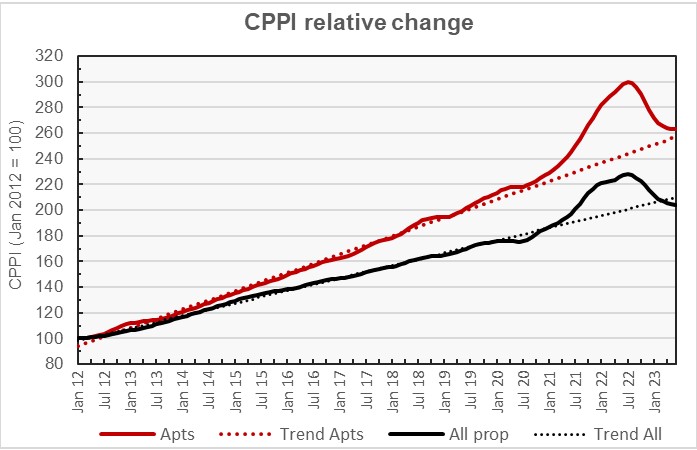
The chart shows that recent price changes have reversed the big gains that were seen starting in the second year of the pandemic. However, the steep rate of price decline that was seen at the end of 2022 and in the first months of 2023 has flattened out somewhat.
Multifamily property prices remain slightly above the long-term trend line, being 2.5 percent above trend currently. However, prices for all commercial property as a single asset class have now fallen 2.7 percent below the long-term trend line.
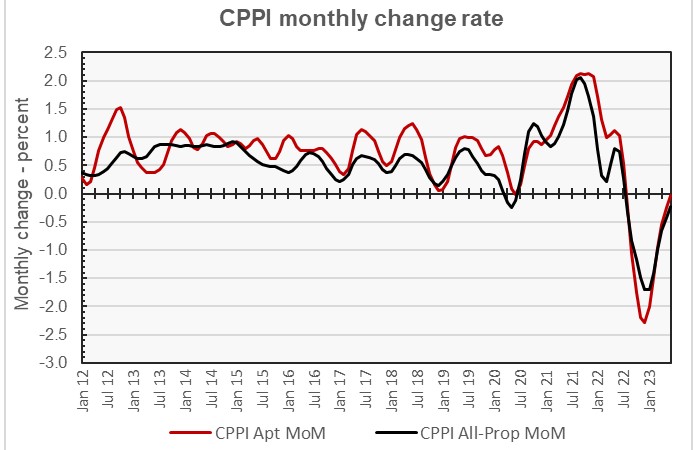
The next chart plots the month-over-month changes in the values of the CPPI since January 2012 for all commercial property as a single asset class and for apartments. The chart shows that month-over-month price drops have been occurring since August 2022, that the rate of price decline peaked in December 2022 and that prices seem to now be stabilizing. Note that the average rate of month-over-month price growth between 2012 and 2020 was 0.8 percent for multifamily property prices and 0.6 percent for all commercial property prices, so the current monthly price appreciation of 0 percent is far from typical for these markets.
Commercial property prices remain below trend
The MSCI report provides data comparing the price changes of commercial property in 6 major metro* areas against those in the rest of the country, although it does not separate out apartments from other commercial property types in this comparison. The next chart, below, plots the history of the relative price indexes since January 2012 for both market segments, along with trend lines based on straight-line fits to the changes in these between January 2012 and December 2019.
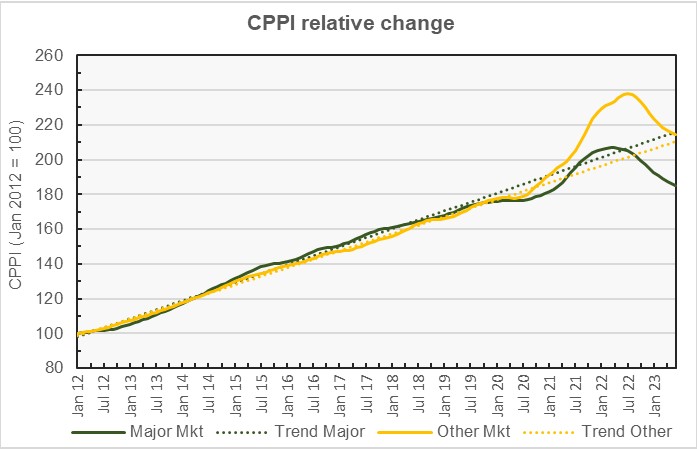
The chart shows that property prices within the major metros never really had the mid-pandemic bounce that happened for prices in other geographies. After the pandemic arrived, major market property prices never exceeded their prior trend by more than about 2.2 percent. They are now 14.4 percent below trend. However, non-major market property prices rose above the trend line by as much as 18.3 percent in mid-2022 and remain 2 percent above their prior trend.
The final chart plots the history of the month-over-month changes in the price indexes for the two property markets since January 2012. The chart shows that month-over-month price appreciation for the other markets exceeded that for major markets for most of the period after January 2020. The rate of price appreciation for both property geographies remained strongly negative in June.
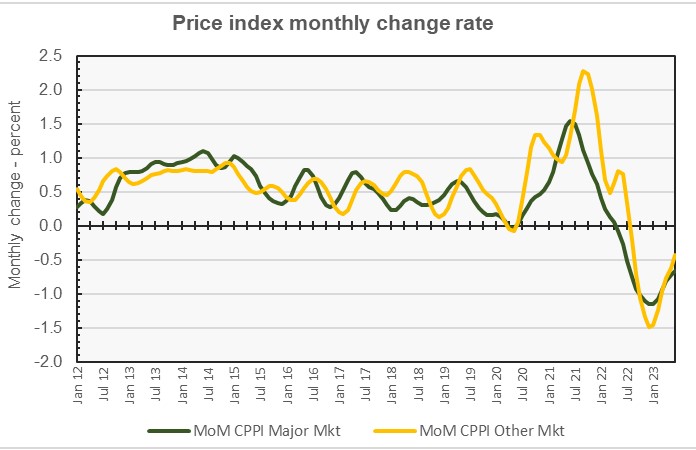
By the numbers, price appreciation for commercial property in major metros was reported to be -0.7 percent for the month and -10.2 percent for the year. Price appreciation for commercial property in non-major markets was reported to be -0.4 month-over-month and -10.3 percent year-over-year.
The full report provides more detail on other commercial property types. Access to the MSCI report can be obtained here.
*The major metros are Boston, Chicago, Los Angeles, New York, San Francisco and Washington DC.


