

Yardi Matrix reported that national average apartment rent increased $7 in June from the revised level of the month before. The average rent reached $1,726 per month.
Year-over-year rent growth rate continues to fall
The national average asking apartment rent was up 1.8 percent in June from its year-earlier level. This rate of increase was down 0.8 percentage points from that reported last month. This continues a more than year-long trend of declining rates of year-over-year rent growth.
Rents in the “lifestyle” asset class, usually Class A properties, were unchanged year-over-year, while rents in “renter by necessity” (RBN) properties increased by 3.8 percent year-over-year. Both rates are once again lower than those reported for the prior month. The chart, below, shows the history of the year-over-year rent growth rates for these two asset classes along with the difference between these rates.
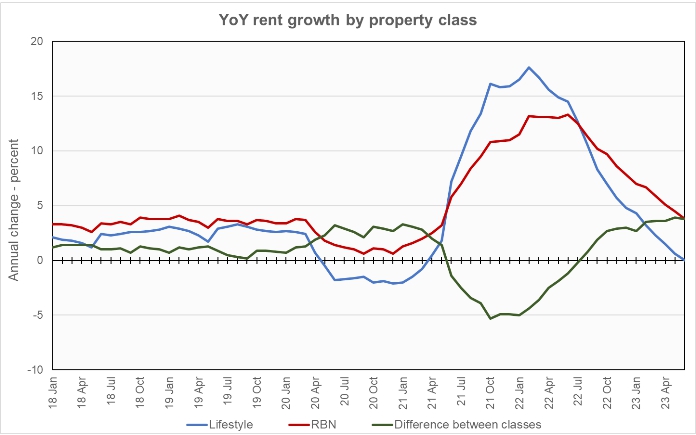
The chart shows that the year-over-year rent growth rate for RBN properties is generally higher than that for lifestyle properties. However, this trend reversed strongly in the second year of the COVID pandemic with rent growth in lifestyle properties being as much 5 percentage points faster year-over-year than that in RBN properties. Now, rent growth in RBN properties is again leading that in lifestyle properties, but the nearly 4 percentage point differential is well above the approximately 1 percentage point differential seen in 2018 and 2019.
The national average lease renewal rate was 64.4 percent in April. This was down 1.5 percentage points from the revised (+4.1 percentage points) value of 65.9 percent for March. Year-over-year rent growth for leases that were renewed was 8.2 percent in February, down from the revised (+0.4 percentage points) level of 8.6 percent for March. Apparently multifamily operators are continuing to attempt to bring the rent levels of their renewed leases to the levels of their current asking rents.
Yardi Matrix reported that U.S. average occupancy rate was unchanged at 95.0 percent in June. However, the report noted that most of the 30 metros for which it reports specific data saw occupancy fall in the month.
Yardi Matrix also reported that single-family rental (SFR) rents rose $5 in June to a level of $2,103 per month. The year-over-year rent growth rate fell to 1.3 percent. The national occupancy rate for single-family rentals in June was up 0.3 percentage points from the level reported for the month before at 95.9 percent.
Tabulating stats
Yardi Matrix reports on key rental market metrics in addition to rent growth. These include the average rent to income ratio, the rent growth rate for residents who renew their leases and the portion of residents who do renew. The metro averages are included in the tables below, but the report also includes the rent to income ratios for both lifestyle and for RBN properties.
With this report, Yardi Matrix changed the metros it tracks. Metros to track are now also chosen for geographic diversity rather than strictly by population. However, the 30 metros it reports on for the rent to income ratio are not exactly the same as the ones for which Yardi Matrix reports the other statistics. Therefore rent to income data are not available for all metros.
Of the Yardi Matrix 30 metros, the 10 with the largest annual apartment rent increases are given in the table below, along with their annual percentage rent changes, overall rent to income ratio, rent growth for renewed leases and renewal rate for the month. The data on asking rent growth is for June. The other data are for April.
| Metro | YoY asking rent growth % | Rent to income ratio % | YoY renewal rent growth % | Monthly lease renewal rate % |
| New Jersey | 6.5 | N/A | 7.6 | 82.3 |
| New York | 6.3 | 36.5 | 10.8 | 65.6 |
| Indianapolis | 6.1 | 26.1 | 10.9 | 66.1 |
| Chicago | 4.9 | 29.3 | 6.9 | 65.7 |
| Boston | 4.7 | 26.8 | 10.9 | 67.9 |
| San Diego | 4.5 | 35.0 | 9.9 | 59.5 |
| Columbus | 4.1 | N/A | 8.9 | 67.2 |
| Philadelphia | 3.1 | 28.8 | 6.7 | 79.7 |
| Detroit | 2.8 | 26.6 | 7.1 | 69.5 |
| Richmond | 2.3 | 31.3 | 10.9 | 61.4 |
The major metros with the smallest year-over-year apartment rent growth as determined by Yardi Matrix are listed in the next table, below, along with the other data as in the table above.
| Metro | YoY asking rent growth % | Rent to income ratio % | YoY renewal rent growth % | Monthly lease renewal rate % |
| Phoenix | (3.6) | 29.8 | 7.1 | 58.7 |
| Las Vegas | (3.3) | 28.6 | 9.0 | 62.8 |
| Austin | (2.7) | 26.2 | 10.1 | 61.4 |
| Seattle | (2.1) | 28.6 | 10.6 | 57.5 |
| Atlanta | (1.1) | 29.8 | 9.2 | 64.3 |
| San Francisco | (0.8) | 32.4 | 5.5 | 51.8 |
| Tampa | (0.7) | 31.7 | 8.9 | 62.9 |
| Raleigh | (0.6) | 28.0 | 11.1 | 63.1 |
| Orlando | (0.3) | 31.7 | 12.2 | 64.1 |
| Portland | 0.2 | 29.5 | 7.8 | 60.8 |
Twenty-one of the 30 metros tracked saw positive rent growth for the month, the same count as for the last two months. However, five of the metros studied this month are new to the list. The top metros for month-over-month rent growth in June were New York, Chicago, Columbus and Boston. The metros with the lowest month-over-month rent growth were Phoenix, Tampa, Austin and Atlanta.
Rising interest rates drive strategy
The discussion section of this month’s report looked at the fallout from rising interest rates and the changing lending environment, including that:
Loan to value ratios are down, often requiring owners to come up with additional equity when refinancing.
Reduced transaction activity means that Fannie Mae and Freddie Mac may not meet their loan allocations for the first time in many years.
Borrowers are choosing shorter-term financing with early repayment options, betting that they will be able to refinance on more favorable terms when the loans come due.
Fewer SFR markets see gains
Yardi Matrix reported on the top 34 metros for single family rentals. This month, 20 of the 34 metros covered saw positive year-over-year rent growth, down one from last month’s count. The leading metros for year-over-year rent growth were Nashville, Baltimore and Chicago, the same as for the last three months.
This month, 10 of the metros saw year-over-year occupancy increases, an increase of 4 from last month’s count. The leading metros for occupancy increases were Las Vegas, Orlando, Sacramento and Atlanta. The metros with the greatest occupancy declines were Washington D.C, Austin, Philadelphia and Raleigh.
The complete Yardi Matrix report provides information on some of the smaller multifamily housing markets. It also has more information about the larger multifamily markets including numbers on job growth and completions of new units. It includes charts showing the history of rent changes in 18 of the top 30 markets over the last 4 years. It can be found here.


