

Yardi Matrix reported that national average apartment rent increased $2 in July from the revised level of the month before. The average rent reached $1,729 per month.
Year-over-year rent growth rate continues to fall
The national average asking apartment rent was up 1.6 percent in July from its year-earlier level. This rate of increase was down 0.2 percentage points from that reported last month.
Rents in the “lifestyle” asset class, usually Class A properties, were down 0.2 percent year-over-year, while rents in “renter by necessity” (RBN) properties increased by 3.4 percent year-over-year. The chart, below, shows the history of the year-over-year rent growth rates for these two asset classes along with the difference between these rates.
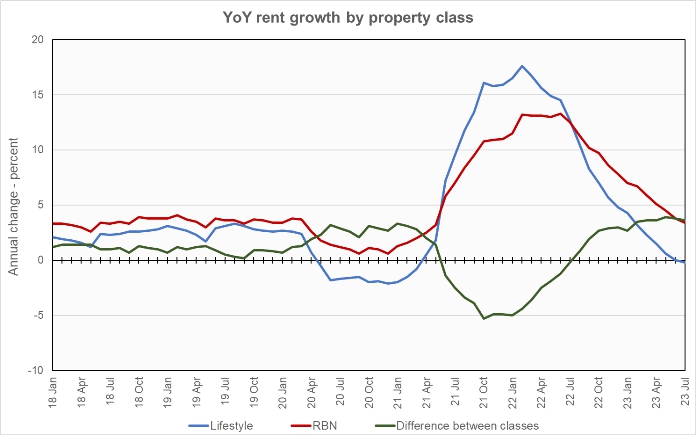
The chart shows that the year-over-year rent growth rate for lifestyle properties has now turned negative. While the rent growth rate for RBN properties also fell, the spread between the rent growth rates for the two property classes remained near its recent highs, with rent growth for RBN properties significantly outpacing that of lifestyle properties.
The national average lease renewal rate was 59.4 percent in May. This is down 5 percentage points from the 64.4 percent lease renewal rate seen in April. Year-over-year rent growth for leases that were renewed was 8.1 percent in May, down from the 8.5 percent lease renewal rent growth rate for April.
Yardi Matrix reported that U.S. average occupancy rate was unchanged again in July at 95.0 percent. However, the report noted that, of the 30 metros for which it reports specific data, only Chicago and New York did not see occupancy fall in the month.
Yardi Matrix also reported that single-family rental (SFR) rents were unchanged in July from the revised (+$5) level of the month before at $2,108 per month. The year-over-year SFR rent growth rate fell to 1.2 percent. However, Nashville, Baltimore and Chicago all achieved double digit year-over-year SFR rent growth in the month. The national occupancy rate for single-family rentals in July was unchanged from the revised level of the month before at 95.8 percent.
Tabulating stats
Yardi Matrix reports on other key rental market metrics in addition to rent growth. These include the average rent to income ratio, the rent growth rate for residents who renew their leases and the portion of residents who do renew. The metro averages are included in the tables below, but the report also includes the rent to income ratios for both lifestyle and for RBN properties.
In last month’s report, Yardi Matrix changed the metros it tracks. Metros to track are now also chosen for geographic diversity rather than strictly by population.
Of the Yardi Matrix 30 metros, the 10 with the largest annual apartment rent increases are given in the table below, along with their annual percentage rent changes, overall rent to income ratio, rent growth for renewed leases and renewal rate for the month. The data on asking rent growth are for July. The other data are for May.
| Metro | YoY asking rent growth % | Rent to income ratio % | YoY renewal rent growth % | Monthly lease renewal rate % |
| Indianapolis | 5.5 | 26.6 | 9.1 | 59.0 |
| New York | 5.5 | 35.9 | 7.7 | 60.9 |
| New Jersey | 5.4 | 29.4 | 7.6 | 80.5 |
| Chicago | 5.2 | 29.2 | 6.6 | 61.4 |
| Boston | 4.3 | 28.5 | 10.4 | 58.9 |
| San Diego | 4.0 | 34.6 | 10.0 | 55.7 |
| Philadelphia | 3.7 | 28.8 | 8.2 | 69.7 |
| Columbus | 3.0 | 27.0 | 8.8 | 61.0 |
| Richmond | 2.5 | 29.8 | 10.0 | 59.9 |
| Miami Metro | 2.2 | 25.6 | 13.3 | 62.4 |
Yardi Matrix reports most of its statistics for New Jersey for the state as-a-whole. However, it reports rent-to-income data for Northern New Jersey and for Central New Jersey separately. Because of this, the rent-to-income value for New Jersey listed above is the average of the Northern and Central values.
The major metros with the smallest year-over-year apartment rent growth as determined by Yardi Matrix are listed in the next table, below, along with the other data as in the table above.
| Metro | YoY asking rent growth % | Rent to income ratio % | YoY renewal rent growth % | Monthly lease renewal rate % |
| Las Vegas | (3.5) | 28.5 | 7.1 | 56.4 |
| Phoenix | (3.1) | 29.2 | 6.4 | 55.1 |
| Austin | (2.8) | 27.2 | 7.5 | 54.1 |
| Seattle | (1.6) | 28.7 | 8.2 | 53.9 |
| Portland | (1.0) | 30.4 | 7.0 | 56.2 |
| Raleigh | (1.0) | 28.4 | 10.7 | 53.3 |
| San Francisco | (1.0) | 31.8 | 2.7 | 46.7 |
| Atlanta | (0.9) | 29.3 | 7.8 | 59.6 |
| Orlando | (0.7) | 32.4 | 12.0 | 59.2 |
| Tampa | (0.2) | 30.3 | 9.4 | 58.2 |
Only 13 of the 30 metros tracked saw positive rent growth month-over-month, down from 21 in last month’s report. The top metros for month-over month rent growth in July were Philadelphia, Chicago, Tampa and Denver. Of these, only Chicago was in the top 4 last month. The metros with the lowest month-over-month rent growth were Columbus, Portland, Orlando and Detroit. None of these metros were in the bottom 4 last month.
High rent growth triggers policy responses
The discussion section of this month’s report talked about policy changes that are being considered at various levels of government in response to the large rent increases that were seen recently, particularly since 2021. Some of the changes, such as potentially imposing rent control, are seen as detrimental by the apartment industry. Others, such as changing zoning laws to make it easier to build multifamily housing and increasing support for developing affordable housing, would be welcomed.
More SFR units coming
Yardi Matrix reported on the top 34 metros for single-family rentals. This month, 20 of the 34 metros covered saw positive year-over-year rent growth, the same as last month. The leading metros for year-over-year rent growth were again Nashville, Baltimore and Chicago.
This month, 11 of the metros saw year-over-year occupancy increases, an increase of 1 from last month’s count. The leading metros for occupancy increases were Las Vegas, Atlanta, Sacramento and Orlando. The metros with the greatest occupancy declines were Washington D.C, Austin, Philadelphia and Lansing.
The report noted that Yardi Matrix has identified 50,000 single-family rental units in communities of 50 or more units which are currently under construction.
The complete Yardi Matrix report provides information on some of the smaller multifamily housing markets. It also has more information about the larger multifamily markets including numbers on job growth and completions of new units. It includes charts showing the history of rent changes in 18 of the top 30 markets over the last 4 years. It can be found here.


