

The producer price index (PPI) report from the Bureau of Labor Statistics (BLS) stated that construction materials prices were unchanged month-over-month in August on a seasonally adjusted basis. The index of components and materials for construction was down 0.4 percent from its year-earlier level.
Overall prices for processed goods for intermediate demand rose by 2.1 percent in the month driven by a 12.1 percent rise in the index for fuels and lubricants. Other components of this index were either flat or down for the month. The processed goods for intermediate demand index was 4.3 percent lower than its year-earlier level.
For reference, the changes in these indexes compare with a 3.7 percent rise in the all-items consumer price index (CPI-U) for the 12 months ending in August. The seasonally adjusted August CPI-U was up 0.6 percent from July’s level. The rise in inflation for the month was driven by a 5.6 percent jump in energy prices. The shelter portion of the CPI-U was up 0.3 percent for the month and was 7.3 percent higher than its year-ago level.
Yield Pro compiled the BLS reported changes for our standard list of construction materials prices. These are prices of materials which directly impact the cost of constructing an apartment building. The two right hand columns of the table provide the percent change in the price of the commodity from a year earlier (12 Mo PC Change) and the percent change in price from July (1 Mo PC Change). If no price data is available for a given commodity, the change is listed as N/A.
The pre-COVID column lists the change in the current construction materials prices relative to the average of prices from December 2019 through February 2020, before the pandemic impacted the economy. This may give a truer idea of the magnitude of the recent price increases for materials, such as lumber, whose prices were already rising sharply last year, than does the 12 Mo PC Change column.
| Commodity | 12 Mo PC Change | 1 Mo PC Change | Pre-covid Change |
| Softwood lumber | (18.0) | (4.4) | 19.7 |
| Hardwood lumber | (16.4) | (2.3) | 21.4 |
| General millworks | (1.9) | (1.1) | 27.7 |
| Soft plywood products | (16.5) | 0.9 | 64.1 |
| Hot rolled steel bars, plates and structural shapes | (9.7) | 0.8 | 60.5 |
| Copper wire and cable | 3.2 | 0.1 | 27.6 |
| Power wire and cable | 26.6 | 5.7 | 119.9 |
| Builder’s hardware | 0.3 | 0.0 | 25.5 |
| Plumbing fixtures and fittings | 2.2 | 0.0 | 17.7 |
| Enameled iron and metal sanitary ware | 3.1 | 0.1 | 21.5 |
| Furnaces and heaters | 3.5 | 0.5 | 35.8 |
| Sheet metal products | (0.7) | 0.4 | 47.0 |
| Electrical Lighting fixtures | 0.7 | 0.0 | 18.1 |
| Nails | (15.9) | (0.1) | 30.4 |
| Major appliances | 1.8 | 1.2 | 22.7 |
| Flat glass | N/A | N/A | N/A |
| Ready mix concrete | 9.6 | 0.4 | 29.7 |
| Asphalt roofing and siding | 3.2 | (1.2) | 38.7 |
| Gypsum products | (0.8) | (0.3) | 41.6 |
| Mineral wool insulation | (0.3) | (1.3) | 40.2 |
The first chart, below, shows the price index history for wood products over the past 37 months. Note that the prices used by the BLS in compiling the indexes are collected on the Tuesday of the week containing the 13th day of the month. In August that would have been August 15. In the September report, the data collection date will be September 12.
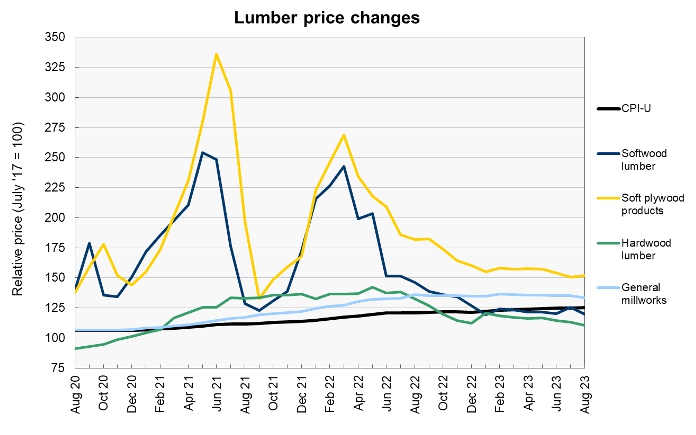
The sometimes volatile prices for wood products have been relatively stable so far during 2023. The price index for softwood lumber was reported to drop 4.4 percent drop this month, but this only reversed last month’s gain. The current price index for softwood products is within 1 percent of its price index in January, as is the price index for general millworks. The index for soft plywood products is down 2 percent since January. Only the price index for hardwood products has changed significantly since January, falling 8.3 percent.
Looking ahead, NASDAQ reported that the market price of lumber closed on August 15 at $512 and fell to $497 on September 12. Lumber prices in the futures markets indicate that only nominal price changes are anticipated for the months ahead. The November 2023 contract closed on September 12 at $499, while the January 2024 contract closed at $513.
The next chart, below, shows the recent history of several other construction materials prices. These are relatively simple commodities whose prices are strongly driven by those of the materials of which they are comprised.
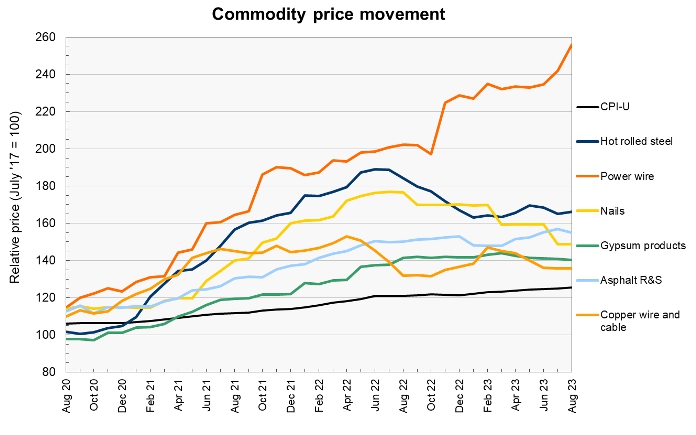
Power wire and cable prices had the highest upward movement in August of the construction materials prices that we track with a rise of 5.7 percent. This was on top of last month’s rise of 3.1 percent. Its price index has now experienced by far the largest post-pandemic increase of the construction materials prices that we track. Its 120 percent rise is nearly double that of the next highest construction materials price index increase.
The price indexes for the other construction materials show in this chart have been relatively stabile this year, although the price index for nails has fallen 12 percent while the price index for asphalt roofing and siding has risen 4.5 percent.
Looking ahead at prices for underlying materials, MarketWatch reported that the NYSE American steel index ended the last 30 days only slightly higher than the point from which it started. It closed at $1,926 on August 15 and closed at $1,940 on September 12, although it traded as high as $2,019 between these dates. Meanwhile, steel futures have been trending lower since our last report. The November contract closed 3 percent lower on September 12 than it did on August 15. However, on September 12, the January 2024 contract closed 8 percent higher than did the November contract so the market is predicting that steel prices will rise in the future.
The price of copper closed at $3.79 per pound on September 12 up $0.08 since August 15. It had closed as high as $3.85 per pound and as low as $3.70 per pound between those dates.
The price of aluminum moved higher in late August. It closed on September 12 at $2,196, up $52 from its level on August 15. However, the August 15 price was near a recent low.
Price changes for several of the more finished goods from our sample are illustrated in the final chart, below.
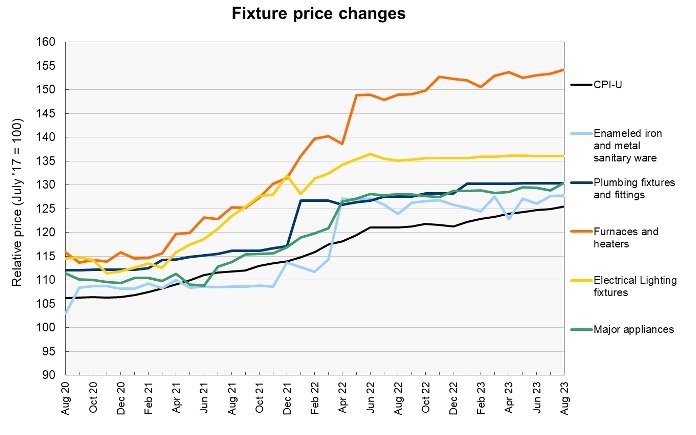
The prices of the construction materials included in this chart did not move significantly over the last year. The biggest rise was 3.5 percent in the price of furnaces and heaters. This is less than the general rate of inflation as measured by the CPI-U. The biggest monthly rise was for major appliances. However, the 1.2 percent rise in this construction materials price index was aided by a downward revision of last month’s price index by 0.7 percent.
The full current BLS report can be found here.


