

Yardi Matrix reported that national average apartment rent growth was $1 in August, compared to the revised rent level of the month before. The average rent reached $1,728 per month.
Rent growth rate continues its decline
The national average asking apartment rent was up 1.5 percent in August from its year-earlier level. This rate of increase was down 0.1 percentage points from that reported last month.
Rents in the “lifestyle” asset class, usually Class A properties, were down 0.1 percent year-over-year, while rents in “renter by necessity” (RBN) properties increased by 3.2 percent year-over-year. The chart, below, shows the history of the year-over-year rent growth rates for these two asset classes along with the difference between these rates.
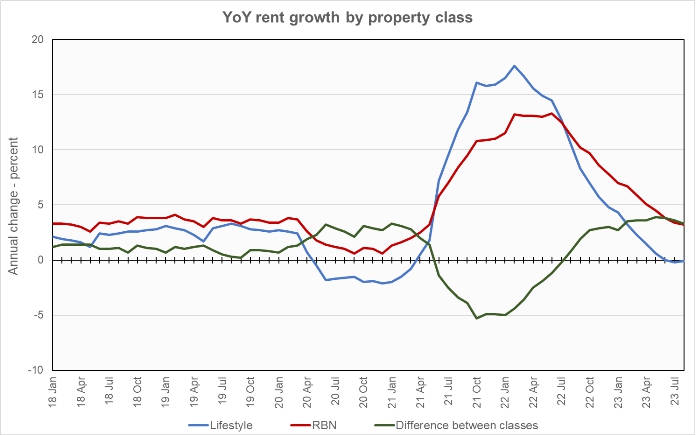
The chart shows that the year-over-year rent growth for lifestyle properties was 0.1 percentage points higher than last month’s reading. The rent growth rate for RBN properties fell by 0.2 percentage points. This caused the spread between the rent growth rates for the two property classes to decrease, although it remains near its highest level for the time-period shown.
The national average lease renewal rate was 62.9 percent in June. This is up 3.5 percentage points from the 59.4 percent lease renewal rate seen in May but still down from the 64.4 percent rate seen in April. Year-over-year rent growth for leases that were renewed was 7.8 percent in June, down from the 8.1 percent lease renewal rent growth rate for May and the 8.5 percent growth rate for April.
Yardi Matrix reported that U.S. average occupancy rate was unchanged again in August at 95.0 percent. However, the report noted that, of the 30 large metros for which it reports specific data, only Chicago saw occupancy rise during the month.
Yardi Matrix also reported that single-family rental (SFR) rents fell $6 in August from the revised (+$2) level of the month before to $2,108 per month. The year-over-year SFR rent growth rate fell to 0.5 percent. Only Chicago achieved double digit year-over-year rent growth in the month.
The national occupancy rate for single-family rentals in August was down slightly from the month before at 95.7 percent.
Tabulating stats
Yardi Matrix reports on other key rental market metrics in addition to rent growth. These include the average rent to income ratio, the rent growth rate for residents who renew their leases and the portion of residents who do renew. The metro averages are included in the tables below, but the report also includes the rent to income ratios for both lifestyle and for RBN properties.
With this report, Yardi Matrix again revised the metros it tracks, adding Kansas City and dropping Richmond. It did this for better geographic balance.
Of the Yardi Matrix 30 metros, the 10 with the largest annual apartment rent increases are listed in the table below, along with their annual percentage rent changes, overall rent to income ratio, rent growth for renewed leases and renewal rate for the month. The data on asking rent growth are for August. The other data are for June.
| Metro | YoY asking rent growth % | Rent to income ratio % | YoY renewal rent growth % | Monthly lease renewal rate % |
| New York | 5.7 | 33.4 | 10.6 | 67.3 |
| New Jersey | 5.4 | 32.9 | 7.3 | 79.9 |
| Chicago | 4.9 | 29.8 | 5.9 | 62.7 |
| Indianapolis | 4.8 | 25.6 | 9.4 | 64.8 |
| Boston | 4.6 | 28.7 | 7.5 | 63.0 |
| Kansas City | 4.5 | 25.1 | 7.2 | 66.7 |
| San Diego | 3.5 | 37.1 | 8.7 | 55.4 |
| Columbus | 3.1 | 27.5 | 7.8 | 65.2 |
| Philadelphia | 2.8 | 29.3 | 7.0 | 73.8 |
| Miami Metro | 2.1 | 27.5 | 12.4 | 66.3 |
Yardi Matrix reports most of its statistics for New Jersey for the state as-a-whole. However, it reports rent-to-income data for Northern New Jersey and for Central New Jersey as separate locales. The rent-to-income value for New Jersey listed above is the average of the Northern and Central values.
The major metros with the smallest year-over-year apartment rent growth as determined by Yardi Matrix are listed in the next table, below, along with the other data as in the table above.
| Metro | YoY asking rent growth % | Rent to income ratio % | YoY renewal rent growth % | Monthly lease renewal rate % |
| Austin | (3.5) | 26.2 | 9.0 | 55.9 |
| Phoenix | (3.5) | 28.8 | 5.7 | 56.6 |
| Las Vegas | (3.0) | 29.2 | 7.2 | 60.5 |
| Atlanta | (1.7) | 29.5 | 6.7 | 63.6 |
| Seattle | (1.7) | 29.4 | 7.0 | 57.5 |
| Portland | (1.5) | 30.7 | 8.4 | 59.8 |
| Orlando | (1.0) | 31.3 | 10.4 | 63.3 |
| San Francisco | (0.9) | 28.5 | 1.8 | 52.4 |
| Nashville | (0.4) | 29.7 | 8.4 | 56.5 |
| Raleigh | (0.4) | 28.7 | 9.7 | 63.5 |
Fifteen of the 30 metros tracked saw positive rent growth month-over-month, up from 13 in last month’s report. Twelve metros saw rents fall, and rents were effectively unchanged in 3 metros.
The top metros for month-over month rent growth in August were Kansas City, Boston, Los Angeles and New York. None of these metros were in the top 4 last month. The metros with the lowest month-over-month rent growth were Nashville, Denver, Austin and Atlanta. None of these metros were in the bottom 4 last month either, showing the volatility of this data.
The report noted that a major reason for the differences in rent growth rates in different metros is the differences in the level of new supply coming to market. High rent growth metros generally have relatively little new supply of units arriving while metros with lagging rent growth generally have relatively high levels of new units coming to market. For example, New York has trailing 12 month completions of 1.1 percent of existing stock while Austin has completions of 4.9 percent of existing stock.
Operating expenses are on the rise
The discussion section of this month’s report talked about the recent acceleration in the rate of growth in multifamily operating expenses. In the 12 months to June 2023, operating expenses rose 9.3 percent compared to a rise of only 5.7 percent in the previous 12 months. Growth in insurance expenses led the way with an 18.8 percent increase. Also growing rapidly were expenses for repairs and maintenance at 14.4 percent and for administrative expenses at 11.8 percent.
The national average operating expense per unit reached $8,694, representing 43 percent of gross income. However, operating expense per unit varies widely, with some large costal metros having much higher expenses. For example, average operating expenses for New York City are $18,484 per unit.
The report concludes that, in an environment of slower rent growth, expense reduction will be the key to increasing net operating income.
SFR markets remain strong
Yardi Matrix reported on the top 34 metros for single family rentals. This month, 17 of the 34 metros covered saw positive year-over-year rent growth. The leading metros for year-over-year rent growth were Chicago, Baltimore and Pittsburgh.
This month, 12 of the metros saw year-over-year occupancy increases, an increase of 1 from last month’s count. Oddly, the three metros with the largest year-over-year occupancy increases, Las Vegas, Sacramento and Seattle, all saw rents fall year-over-year. The metros with the greatest occupancy declines were Washington D.C, Austin and Philadelphia. Philadelphia was fourth on the list for fastest year-over-year rent growth, although both Washington DC and Austin saw rents fall.
The complete Yardi Matrix report provides information on some of the smaller multifamily housing markets. It also has more information about the larger multifamily markets including numbers on job growth and on completions of new units. It includes charts showing the history of rent changes in 18 of the top 30 markets over the last 4 years. It can be found here.


