

A new report from CBRE states that cap rates for prime class A multifamily assets moved higher in Q3 as both the 10-year Treasury yield and the Fed Funds rate also rose.
The pulse of the market
The report surveys CBRE investment professionals in 15 major markets to gather their opinions on the current underwriting assumptions being used by buyers in their markets. Buyers are considering the highest quality assets in the best locations in these markets.
The chart, below, shows the recent history of the survey results for assumptions about the average annual rent growth expected for the first three years after a property is purchased, the going-in cap rate, the exit cap rate and the 10-year Treasury rate.
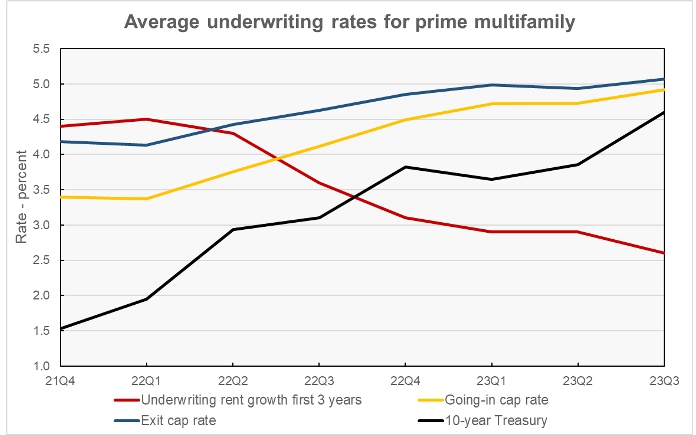
The chart shows that cap rates used in underwriting assumptions have risen over the last 7 quarters as the Federal Reserve has raised interest rate and the bond market has driven up the rate for the 10-year Treasury. At the same time, the expectation for future rent increases has fallen.
The general belief is that the Fed is near the end of its interest rate hikes for this cycle. As interest rates are a major influence on cap rates, CBRE believes that rates may also be near their peak. However, cap rate increases through early 2024 are still possible.
In the Q3 survey, CBRE found that the average going-in cap rate rose 19 basis points to 4.92 percent. The exit cap rate rose 12 basis points to 5.07 percent. The 15 basis spread between going-in and exit rates is the lowest CBRE has seen in the data they presented, which goes back to Q4 2019.
The average assumed holding period for a newly purchased property has been between 8.5 years and 9.3 years in recent surveys. The average assumed holding period in the Q3 survey is 8.6 years.
Markets vary
The submarket with the lowest cap rates was Intown Dallas, with a going-in range of 3.75 to 4.5 percent and an exit range of 4.0 to 4.75 percent. The submarket with the highest in cap rates was West End Washington D.C. with a going-in range of 5.5 to 6.0 percent and an exit range of 5.25 to 5.5 percent.
While exit cap rates are generally higher than going-in rates, exit rates are at parity with or below going-in rates in Chicago, New York, Phoenix, Seattle, in addition to Washington D.C.
Rent growth trends
CBRE quotes rents on a dollars per square foot per month basis, so it is difficult to make comparisons between their estimates of rent levels with those from other sources.
CBRE’s underwriting rent level fell to $4.50 in Q3 from $4.55 per square foot in Q2, a decline of 1.1 percent. However, CBRE found rents in Q3 2023 to be 1.1 percent higher than their levels one year earlier. By comparison, data from Apartment List says that rents in September 2023 were 0.3 percent below their levels in June and 1.2 percent below their levels in September 2022.
The full CBRE report can be found here.


