

The latest commercial property price report from MSCI Real Capital Analytics said that multifamily property prices in September were down 0.3 percent from their level of the month before and down 12.8 percent from their level of one year before.
Defining CPPI
MSCI tracks an index called the Commercial Property Price Index (CPPI). The index is computed based on the resale prices of properties whose earlier sales prices and sales dates are known. The index represents the relative change in the price of property over time rather than its absolute price. Note that, as new properties are added to the MSCI dataset each month, they recalculate the CPPI all the way back to the beginning of the data series.
Apartment prices fall
The first chart, below, shows how the CPPI’s for all commercial property as a single asset class and for apartments have changed since January 2016. To simplify the comparison, both CPPI’s have been normalized to values of 100 in January 2012. The chart also contains trend lines showing the straight-line average rates of price appreciation for the two asset classes based on their performance from January 2012 to December 2019.
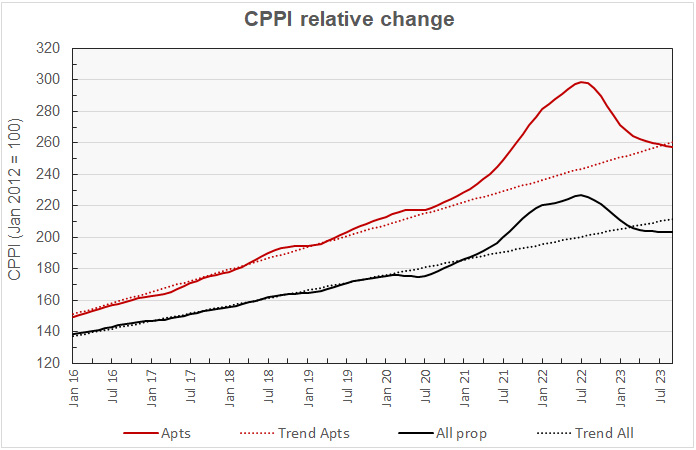
The chart shows that multifamily property prices have given back the outsized gains they experienced during the pandemic and are now 1.2 percent below the long-term trend line.
Prices for all commercial property as a single asset class are now 3.9 percent below trend, up from the revised gap of 3.5 percent seen last month.
The next chart plots the month-over-month changes in the values of the CPPI since January 2016 for all commercial property as a single asset class and for apartments. The chart shows that month-over-month price changes for apartments has been nearly constant at -0.34 percent for the last three months.
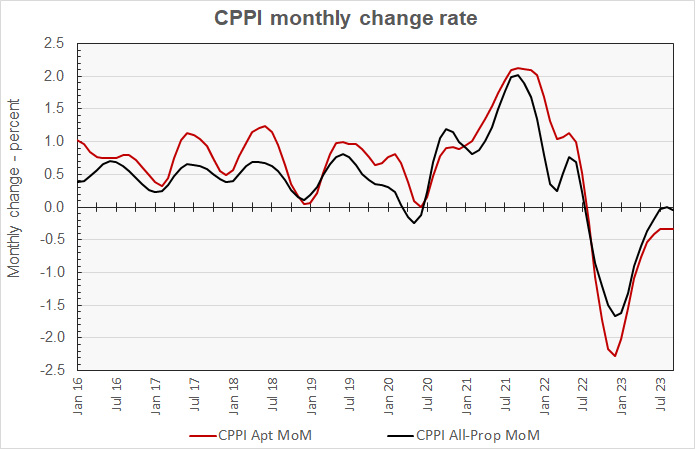
The CPPI for all commercial property was effectively unchanged in August, based on revised data in this month’s report. However, it fell again in September, although by less than 0.1 percent.
Other property prices mostly lower
On a month-over-month basis, the industrial property class was the only one to see prices rise in September, with a gain of 0.2 percent. Prices for office properties within central business districts (CBDs) were unchanged again for the month while prices for suburban offices fell by 0.3 percent. Prices for retail property fell 0.1 percent.
All property types tracked by MSCI experienced price declines on a year-over-year basis. Industrial property was again the best performing with a price drop of 0.8 percent. Prices for offices within CBD’s were down 5.6 percent while prices for suburban offices fell 9.0 percent. Prices for retail property were down 6.9 percent.
Commercial property prices remain below trend
The MSCI report provides data comparing the price changes of commercial property in 6 major metro* areas against those in the rest of the country, although it does not separate out apartments from other commercial property types in this comparison. The next chart, below, plots the history of the relative price indexes since January 2016 for both market segments, along with trend lines based on straight-line fits to the changes in these indexes between January 2012 and December 2019. For purposes of this chart, both price indexes were set to a value of 100 for January 2012.
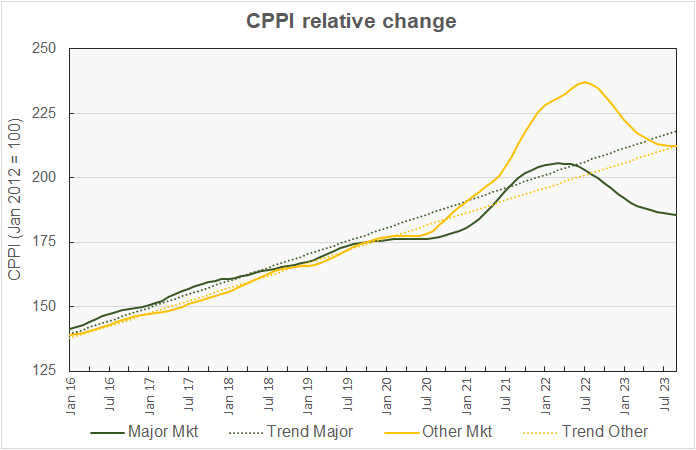
The chart shows that property prices within the major metros stagnated at the onset of the pandemic and did not experience the price surge that property in other markets saw starting in mid-2021. Lately, pricing for property in the major markets has been falling both when compared to its trend line and in absolute terms. Pricing is now 15.0 percent below the trend.
Property prices in other markets have now fallen marginally below their prior long-term trend.
The final chart plots the history of the month-over-month changes in the price indexes for the two property markets since January 2016. The chart shows that month-over-month price appreciation for both market segments continue to be negative. However, prices in other markets were down only slightly month-over-month in September.
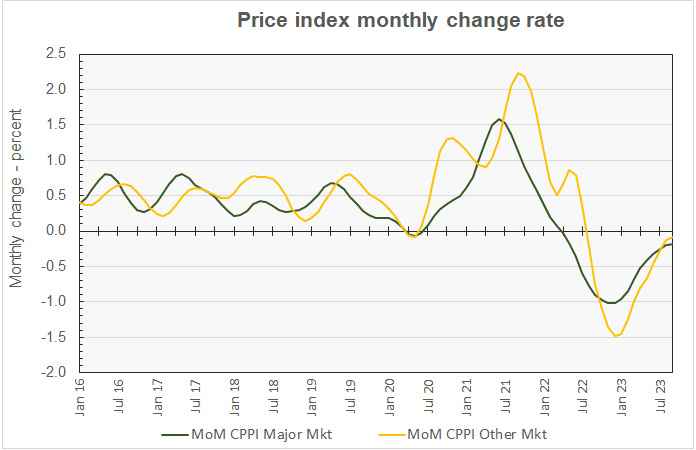
By the numbers, price appreciation for commercial property in major metros was reported to be -0.2 percent for the month and -7.2 percent for the year. Price appreciation for commercial property in non-major markets was reported to be -0.1 percent month-over-month and -9.6 percent year-over-year.
The full report provides more detail on other commercial property types. Access to the MSCI report can be obtained here.
*The major metros are Boston, Chicago, Los Angeles, New York, San Francisco and Washington DC.


