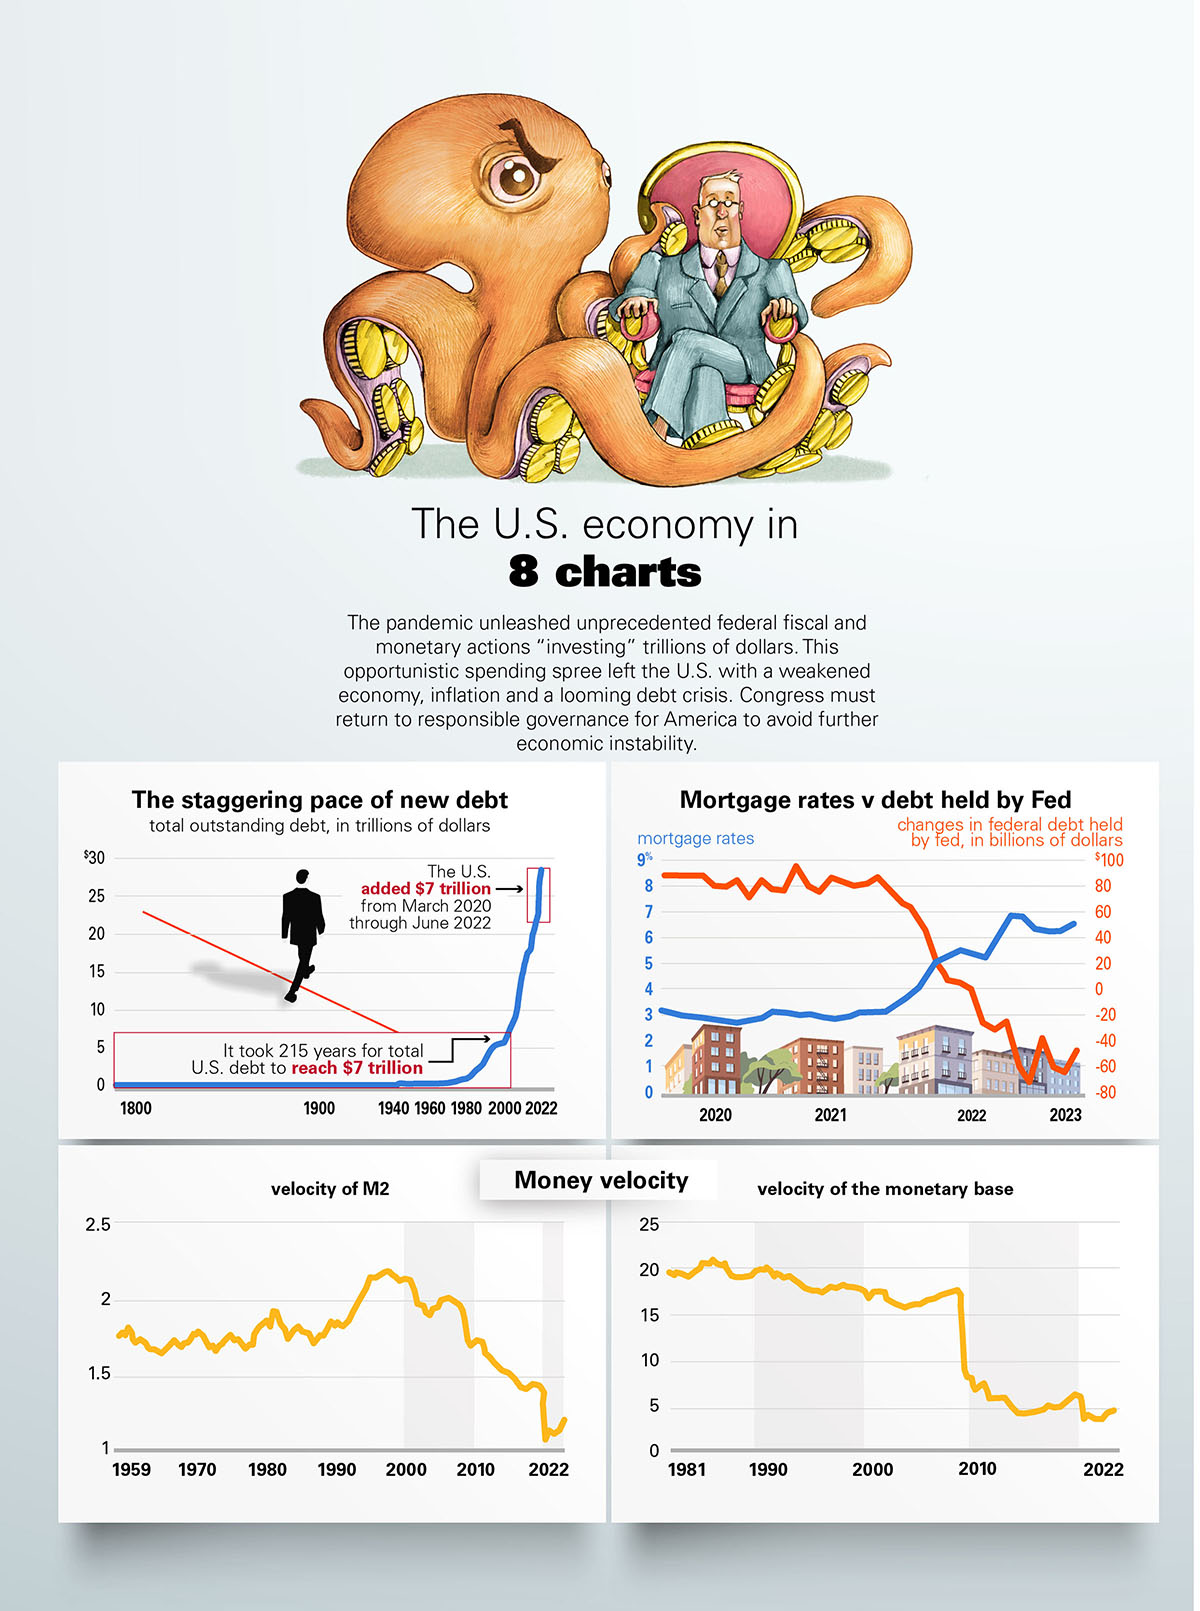
 The U.S. economy in 8 charts
The pandemic unleashed unprecedented federal fiscal and monetary actions “investing” trillions of dollars. This opportunistic spending spree left the U.S. with a weakened economy, inflation and a looming debt crisis. Congress must return to responsible governance for America to avoid further economic instability.
The staggering pace of new debt total outstanding debt, in trillions of dollars
The U.S. added $7 trillion from March 2020 through June 2022
It took 215 years for total U.S. debt to reach $7 trillion
The Monetary Base and M2. The monetary base and M2134 Investopedia, “M2 Definition and Meaning in the Money Supply” are the two most commonly used metrics. The monetary base represents the total amount of U.S. dollars in circulation. In contrast, M2 represents the monetary base plus demand deposits, money market accounts, and other items that are essentially U.S. dollars. Thus, M2 captures the effective creation of money through the private banking sector in response to economic activity and federal monetary policy (including the size of the monetary base).
From 1959, for M2, and from 1981, for the monetary base, through 2008 these velocities were relatively stable. Though the Federal Reserve makes such data on the monetary base available as early as 1959, data from before 1981 was excluded to better reflect monetary policy prior to the 2008 QE rounds. The period from 1959 through 1980 contains periods when the U.S. dollar was coupled to gold, then decoupled from gold in 1971, and the transition period that followed before the period of Volcker disinflation and the monetary policy that existed from then until the QE rounds that started in 2008. However, the stark drop in these monetary velocities after 2008 is reflective of the various rounds of so-called quantitative easing (QE) that the Fed has engaged in over the past 14 years. Moreover, the drop in velocity has been significantly worse since 2020 in direct response to monetary policy designed to facilitate dramatic expansions of federal deficits.
Using Monetary Policy to Enable Expanded Deficits. Monetary policy is a prime determinant of the stability of an economy’s prices and interest rates. It is crucial that monetary policy be focused on stabilizing prices. A central purpose of a currency is to be a stable and reliable yardstick to measure economic activity. Without stable prices, a nation’s currency fluctuates wildly and ceases to serve as a useful yardstick. However, clearly, that requires something else—a fiscally responsible government. Regular and tremendous government deficits make sound monetary policy impossible.
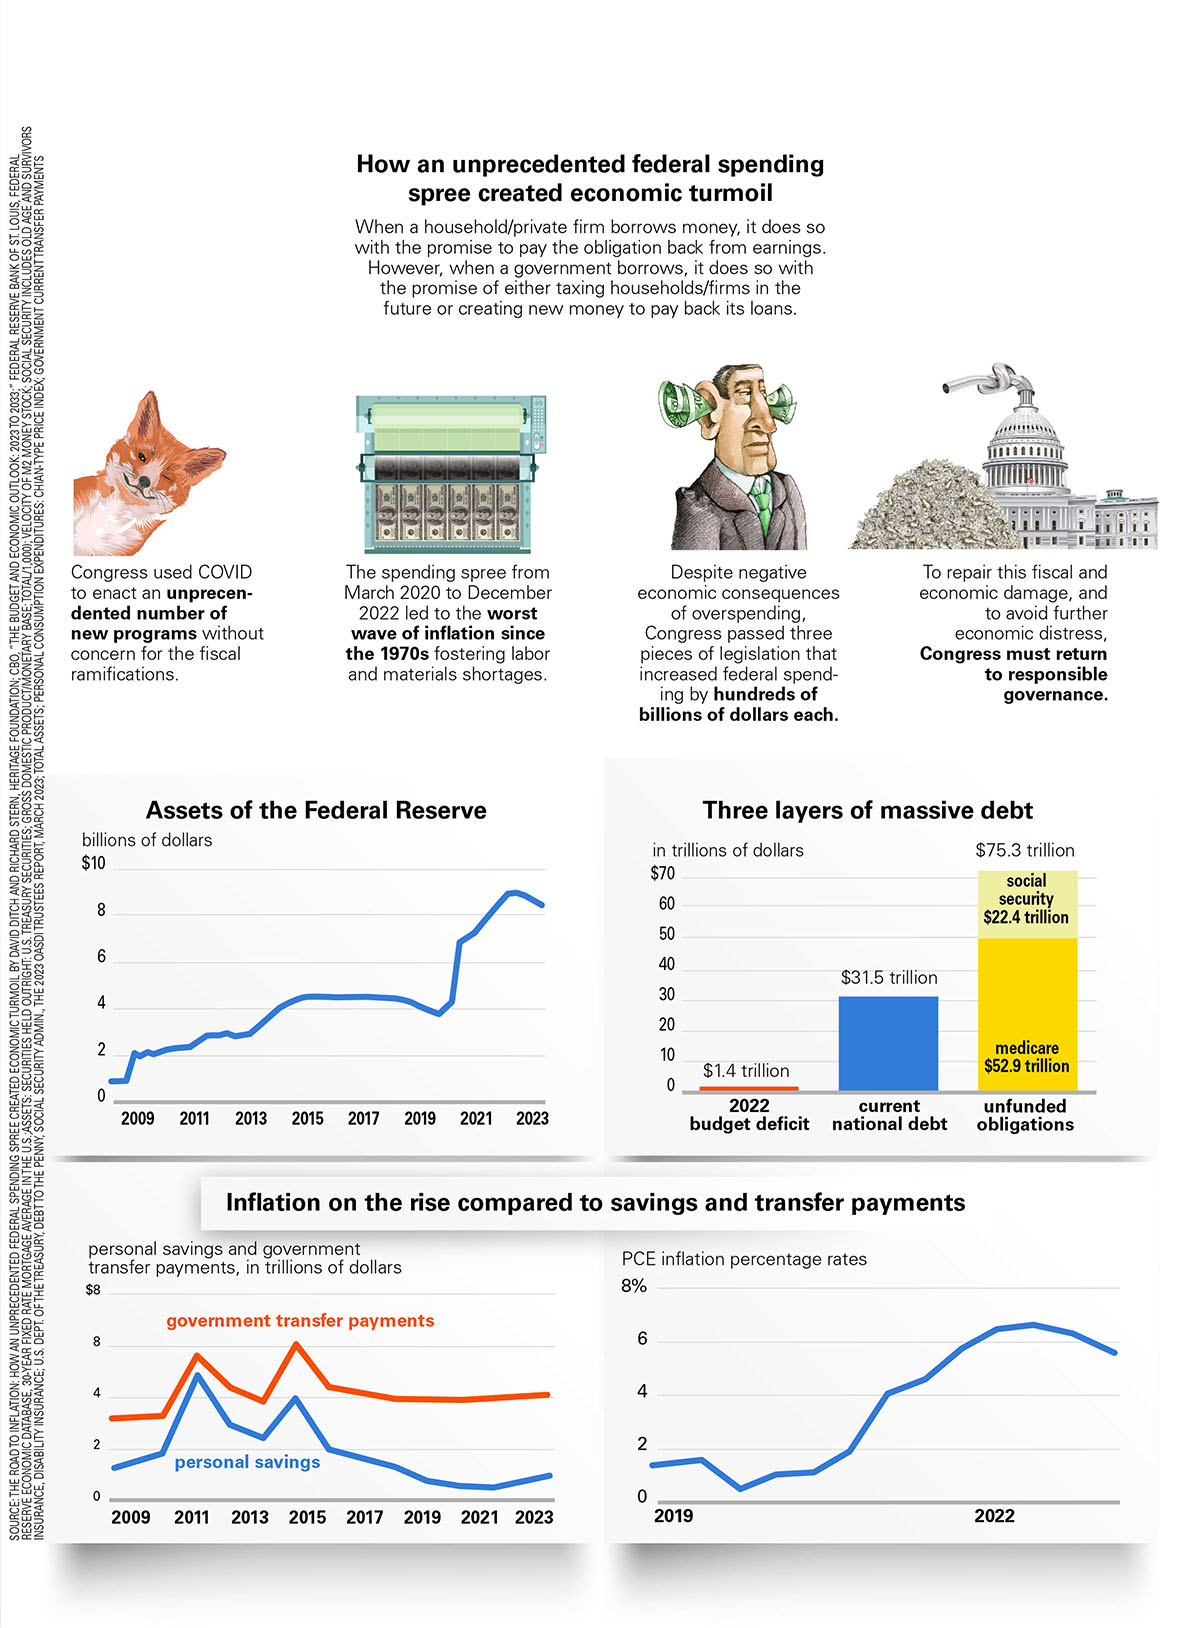
How an unprecedented federal spending spree created economic turmoil
When a household/private firm borrows money, it does so with the promise to pay the obligation back from earnings. However, when a government borrows, it does so with the promise of either taxing households/firms in the future or creating new money to pay back its loans.
Congress used COVID to enact an unprecedented number of new programs without concern for the fiscal ramifications.
The spending spree from March 2020 to December 2022 led to the worst wave of inflation since the 1970s fostering labor and materials shortages.
Despite negative economic consequences of overspending, Congress passed three pieces of legislation that increased federal spending by hundreds of billions of dollars each.
To repair this fiscal and economic damage, and to avoid further economic distress, Congress must return to responsible governance.
Assets of the Federal Reserve in billions of dollars
Three layers of massive debt in billions of dollars
Inflation on the rise compared to savings and transfer payments, personal savings and government transfer payments, in trillions of dollars
PCE inflation percentage rates
SOURCE: THE ROAD TO INFLATION: HOW AN UNPRECEDENTED FEDERAL SPENDING SPREE CREATED ECONOMIC TURMOIL BY DAVID DITCH AND RICHARD STERN, HERITAGE FOUNDATION; CBO, “THE BUDGET AND ECONOMIC OUTLOOK: 2023 TO 2033;” FEDERAL RESERVE BANK OF ST. LOUIS, FEDERAL RESERVE ECONOMIC DATABASE, 30-YEAR FIXED RATE MORTGAGE AVERAGE IN THE U.S.;ASSETS: SECURITIES HELD OUTRIGHT: U.S. TREASURY SECURITIES; GROSS DOMESTIC PRODUCT/MONETARY BASE; TOTAL/1,000); VELOCITY OF M2 MONEY STOCK; SOCIAL SECURITY INCLUDES OLD AGE AND SURVIVORS INSURANCE, DISABILITY INSURANCE; U.S. DEPT. OF THE TREASURY, DEBT TO THE PENNY, SOCIAL SECURITY ADMIN., THE 2023 OASDI TRUSTEES REPORT, MARCH 2023; TOTAL ASSETS; PERSONAL CONSUMPTION EXPENDITURES: CHIAN-TYPE PRICE INDEX; GOVERNMENT CURRENT TRANSFER PAYMENTS