

The latest commercial property price report from MSCI Real Capital Analytics said that multifamily property prices in October were down 1.0 percent from their level of the month before and down 12.6 percent from their level of one year before.
Defining CPPI
MSCI tracks an index called the Commercial Property Price Index (CPPI). The index is computed based on the resale prices of properties whose earlier sales prices and sales dates are known. The index represents the relative change in the price of property over time rather than its absolute price. Note that, as new properties are added to the MSCI dataset each month, they recalculate the CPPI all the way back to the beginning of the data series.
Apartment prices fall faster
The first chart, below, shows how the CPPI’s for all commercial property as a single asset class and for apartments have changed since January 2016. To simplify the comparison, both CPPI’s have been normalized to values of 100 in January 2012. The chart also contains trend lines showing the straight-line average rates of price appreciation for the two asset classes based on their performance from January 2012 to December 2019.
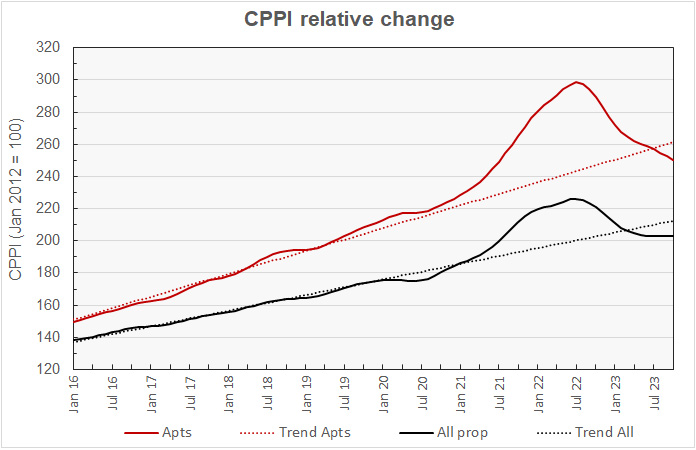
The chart shows that multifamily property prices dropped below their long-term trend in July and have continued to fall further behind since then, They are now 4.3 percent below their long-term trend, although they remain 17.4 percent above their level in January 2020.
Prices for all commercial property as a single asset class fell below their long-term trend in March and have also continued to fall further behind since then. However, as of October, they are also 4.3 percent below their long-term trend. Prices for all commercial property as a single asset are 15.9 percent above their level in January 2020.
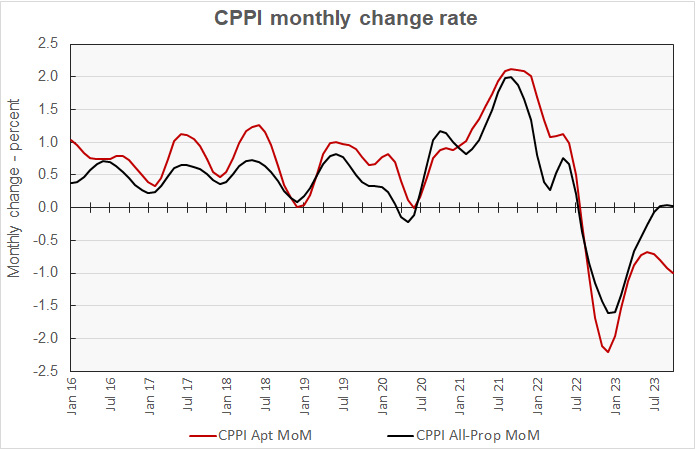
The next chart plots the month-over-month changes in the values of the CPPI since January 2016 for all commercial property as a single asset class and for apartments. The chart shows that, based on current data, the rate that multifamily property prices are falling has accelerated in recent months. On the other hand, prices for all commercial property as a single asset class have remined relatively stable for the last three months.
As noted above, as more transaction data is collected, the various CPPI’s are recalculated for earlier months. The resulting revisions to the multifamily price data was especially pronounced this month. The revisions are illustrated in the next chart, which zooms in on the CPPI month-over-month change data since 2022 as reported this month and as reported last month for the two asset classes we’ve been discussing.
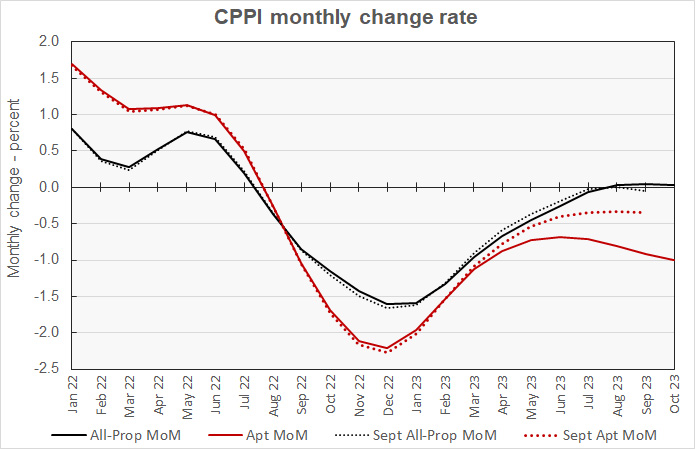
The chart shows that the revisions to the all-property CPPI were relatively minor while the changes to the multifamily property CPPI were significant. While last month’s data seemed to indicate that the rate of decline in multifamily property prices was stabilizing, this month’s data indicates that the rate of decline is worsening.
Industrial is bright spot
On a month-over-month basis, the industrial property class was again the only one to see prices rise in October, with a gain of 0.6 percent. Prices for office properties within central business districts (CBDs) fell 0.2 percent for the month while prices for suburban offices fell by 0.4 percent. Prices for retail property fell 0.3 percent.
Industrial property was again the best performing on a year-over-year basis, managing a gain of 1.5 percent. Prices for offices within CBDs were down 6.7 percent while prices for suburban offices fell 9.5 percent. Prices for retail property were down 7.2 percent.
Commercial property prices nearly unchanged
The MSCI report provides data comparing the price changes of commercial property in 6 major metro* areas against those in the rest of the country, although it does not separate out apartments from other commercial property types in this comparison. The next chart, below, plots the history of the relative price indexes since January 2016 for both market segments, along with trend lines based on straight-line fits to the changes in these indexes between January 2012 and December 2019. For purposes of this chart, both price indexes were set to a value of 100 for January 2012.
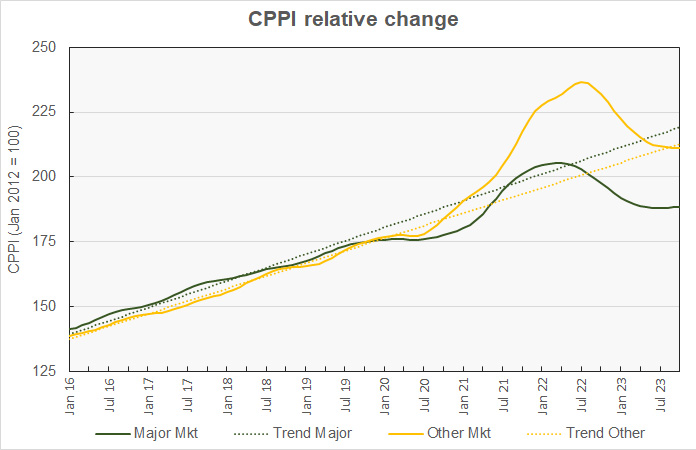
The chart shows that by far the greatest deviation from the long-term commercial property pricing trends is occurring in the major metros. The CPPI for major metro commercial property is now 14 percent below its long-term trend. By contrast, the CPPI for property in other markets is now less than one percent below trend.
The final chart plots the history of the month-over-month changes in the price indexes for the two property markets since January 2016. The chart shows that month-over-month price appreciation for major markets is now marginally positive while that for the other metros is at break-even. However, it should be noted that the monthly appreciation in the CPPIs would have to reach 0.8 percent in order for their gains to match the prior trend-line.
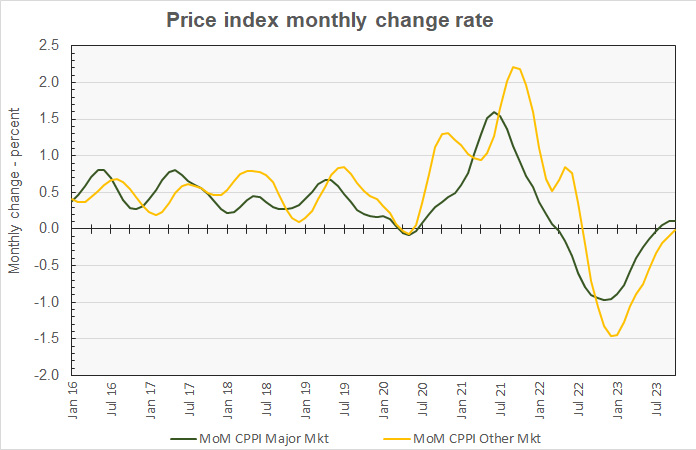
By the numbers, price appreciation for commercial property in major metros was reported to be 0.1 percent for the month and -4.6 percent for the year. Price appreciation for commercial property in non-major markets was reported to be -0.1 percent month-over-month and -9.6 percent year-over-year.
The full report provides more detail on other commercial property types. Access to the MSCI report can be obtained here.
*The major metros are Boston, Chicago, Los Angeles, New York, San Francisco and Washington DC.


