

A report from the Mortgage Bankers’ Association (MBA) says that multifamily mortgage originations in Q3 2023 were down 16 percent quarter-over-quarter and were down 50 percent year-over-year. Originations of all commercial mortgages as a single asset class fell 7 percent quarter-over-quarter and 44 percent year-over-year.
Commercial mortgage originations declining year-over-year
The first chart, below, shows the MBA’s quarterly origination volume indexes since Q1 2018 for both all commercial mortgages as a single asset class and for multifamily mortgages. The indexes are reported relative to the year 2001, with the average quarterly volume in that year defined as a value of 100.
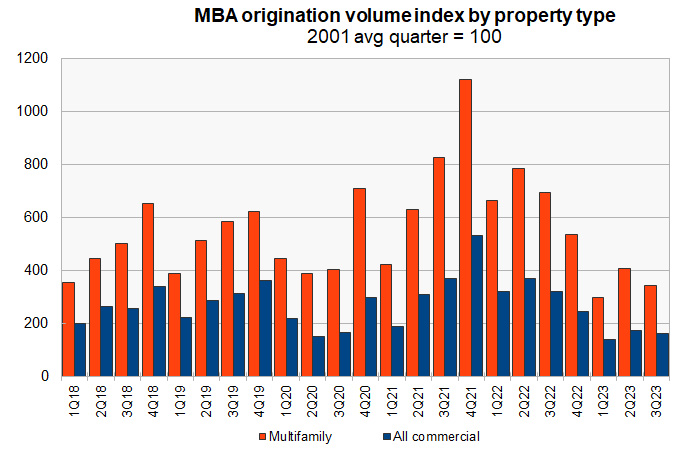
The year 2023 started out following the usual pattern with mortgage origination volume in Q1 declining from the level in Q4 of the previous year, and then volume building quarter by quarter throughout the year. Generally, the mortgage origination volume in each quarter is higher than that in the same quarter in the previous year. This pattern can be seen in the pre-pandemic years of 2018, 2019 but also in 2021.
After being disrupted by the pandemic, the “usual” pattern of growth in mortgage originations was restored in Q2 2021. However, this pattern was again disrupted starting in Q3 2022 as rising interest rates put pressure on commercial mortgage lending. Over the last 4 quarters, origination volumes have consistently fallen by about 50 percent year-over-year.
Results varied for the six property categories mentioned in the report (multifamily, office, retail, industrial, hotel and health care). On a quarter-over-quarter basis, mortgage originations for industrial property grew the most, rising 36 percent. Mortgage origination volumes for office and hotel properties also eked out gains, rising 4 percent and 2 percent respectively. However, originations for retail and health care properties were lower, falling 20 percent and 28 percent respectively.
Who’s lending
The MBA report also includes data on the sources of the commercial mortgages being originated. However, this section of the report does not break out multifamily mortgages from lending on other types of commercial real estate.
The report provides data on five categories of lenders: commercial mortgage-backed securities (CMBS) and conduits, depositories (aka commercial banks and savings and loans), life insurance companies, the government sponsored entities (GSEs), Fannie Mae and Freddie Mac, and investor-driven lenders such as REITs and specialty finance companies.
The index values are quoted relative to the average quarterly origination volumes in the year 2001. The index values of different originators cannot be used to compare their absolute levels of mortgage originations since their origination levels in the baseline year of 2001 were different. To gain insight into the absolute levels of funding provided by the different classes of originators, readers should look to the MBA’s report on mortgage debt outstanding. However, the origination index values can be compared to see which classes of originators are growing their businesses and which are not.
The final chart shows the history of commercial mortgage origination volume indexes since Q1 2018 by class of lender. It shows that commercial mortgage originations in Q3 fell for four of the five classes of lenders.
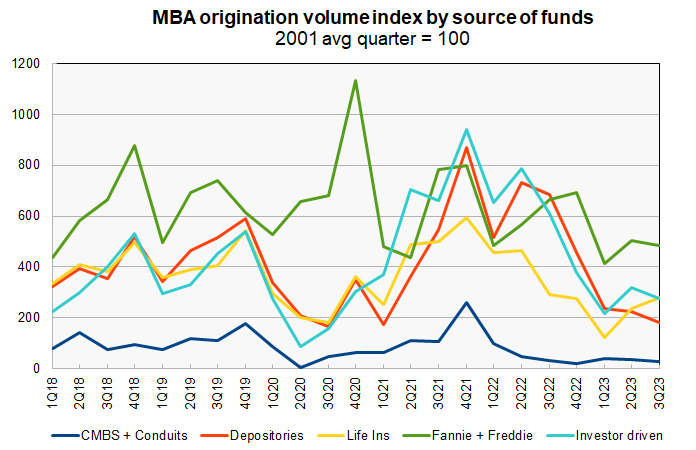
Compared to Q2, life insurers were the only class of lenders to increase originations with a rise of 18 percent for the quarter. However, commercial mortgage originations by life insurers were down 47 percent year-over-year, about middle of the pack for the lenders tracked by the MBA. Quarterly declines in originations varied from 4 percent for the GSE’s to 21 percent for CMBS + conduits.
All five classes of lenders saw their commercial mortgage originations fall year-over-year. Issuance fell 3.2 percent for CMBS, 3.4 percent for life insurers, 27.1 percent for GSEs, 54.5 percent for investor-driven lenders and 73.2 percent for depositaries.
The full report from the MBA includes additional information on lending for other commercial property types. It can be found here.


