

The latest rent report from Apartment List shows that the national median monthly rent growth in November was -0.9 percent. Year-over-year rent growth was -1.1 percent.
Apartment List reported the national median apartment rent to be $1,340, down $13 from last month’s figure.
Visualizing the data
The first chart shows the history of the national median rent level since 2017. It is plotted year-by-year so that the annual change pattern is visible.
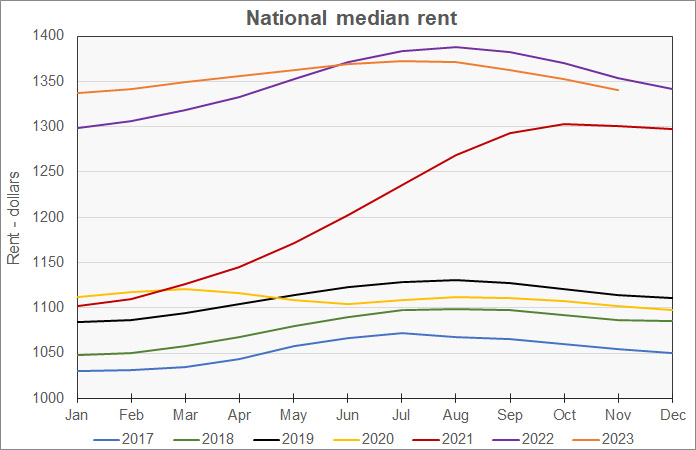
The chart shows that year-over-year rent growth has been negative since June while month-over-month rent growth has been negative since August.
The pre-pandemic rent growth pattern had rents consistently rising year-over-year with an average gain of 2.8 percent. Seasonal month-over-month rent declines would start in either August or September and continue through January.
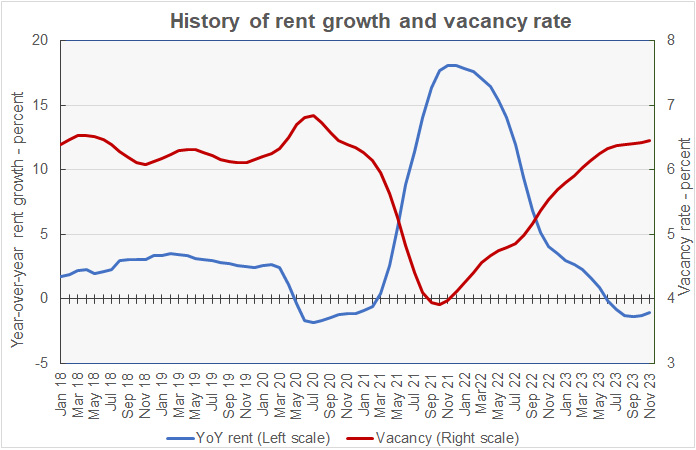
The next chart shows the year-over-year rate of rent growth since January 2018 plotted along with the national median apartment vacancy rate. The chart shows that the current vacancy rate is 6.45 percent. This compares to an average vacancy rate of 6.28 percent for 2018 and 2019. Over the last 4 months, the national average vacancy rate has crept up from 6.40 percent to its current 6.45 percent. Year-over-year rent growth at -1.08 percent is up from -1.28 percent last month and -1.36 percent the month before.
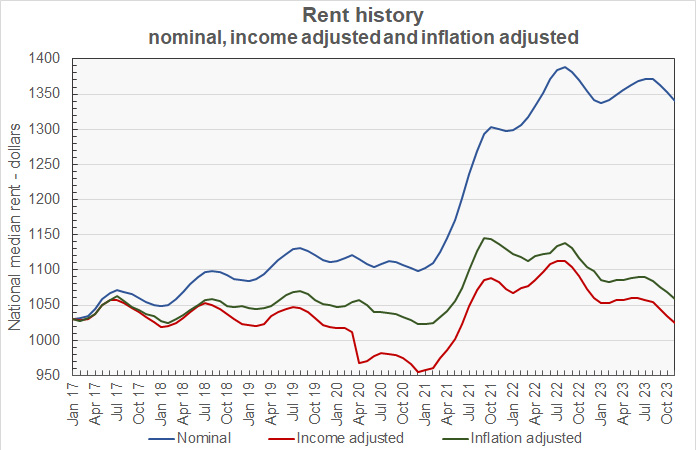
The final chart shows the change in the national median apartment rent since January 2017 in nominal dollar terms along with two other measures of rent accounting for changes in income and price levels. The Income adjusted curve adjusts the rent by the change in average hourly earnings as reported by the Bureau of Labor Statistics. The Inflation adjusted curve adjusts the rent by the general change in price level as measured by the Consumer Price Index for all urban consumers (CPI-U). The curves show that, while rents have soared in nominal terms, when adjusted for wage growth or for the general increases in prices, they are nearly at the same levels they were at prior to the pandemic.
Leaders and trailers
Apartment List provides the underlying data they collected in compiling their report and that data was used to create the tables, below. The tables look at the 50 most populous metropolitan statistical areas defined by the US Census Bureau and identify the top and bottom 10 metros for year-over-year rent growth. The tables provide the median monthly rent in the metro, the metro’s vacancy rate, the annual percentage change in rent (YoY Metro) along with the percentage change from the prior month’s rent level (MoM Metro). They also list the percentage changes in rent for the metro areas compared to the rent levels in February 2020, right before the pandemic struck (Feb 20).
The first table shows the 10 metros with the largest annual rent percentage increases. The list is notable for the absence of fast growing sunbelt cities.
| Metro | Metro Rent | Vacancy | YoY Metro | MoM Metro | Feb 20 |
| Providence | $1,448 | 4.7 | 4.7 | (1.24) | 31.6 |
| Milwaukee | $1,142 | 6.4 | 4.4 | (0.34) | 21.5 |
| Louisville | $1,101 | 6.0 | 3.5 | (0.46) | 21.9 |
| Chicago | $1,427 | 5.3 | 3.4 | (0.95) | 18.5 |
| Oklahoma City | $1,130 | 6.1 | 3.1 | 0.01 | 27.0 |
| Boston | $1,958 | 5.1 | 2.9 | (1.03) | 17.5 |
| Hartford | $1,501 | 5.3 | 2.9 | (0.57) | 26.7 |
| New York | $2,064 | 4.3 | 2.9 | (0.90) | 18.7 |
| Washington | $1,973 | 5.2 | 2.4 | (0.75) | 12.7 |
| Indianapolis | $1,205 | 5.9 | 2.3 | (0.12) | 30.0 |
The next table shows the 10 metros with the smallest annual rent increases.
| Metro | Metro Rent | Vacancy | YoY Metro | MoM Metro | Feb 20 |
| Austin | $1,558 | 8.9 | (6.2) | (1.45) | 17.3 |
| Portland | $1,492 | 6.6 | (5.3) | (1.04) | 12.0 |
| San Francisco | $2,036 | 5.6 | (4.2) | (1.36) | (5.8) |
| Phoenix | $1,532 | 6.8 | (4.2) | (0.91) | 25.9 |
| Atlanta | $1,479 | 7.1 | (4.2) | (1.23) | 21.7 |
| Orlando | $1,579 | 6.8 | (3.9) | (1.18) | 25.1 |
| Raleigh | $1,474 | 7.7 | (3.8) | (1.49) | 25.9 |
| Jacksonville | $1,444 | 6.6 | (3.6) | (1.07) | 27.3 |
| San Antonio | $1,243 | 8.7 | (3.0) | (1.22) | 16.7 |
| Salt Lake City | $1,436 | 7.9 | (3.0) | (0.63) | 25.1 |
In November, 28 of the 50 most populous metros saw their rents decline on a year-over-year basis. However, 48 of the metros saw rents decline on a month-over-month basis. San Francisco remains the only top-50 metro that still has rents that are below their level in February 2020, immediately before the pandemic.
The average rent in the 10 metros with the highest rent growth is $1,495 per month, while the average rent charged in the 10 lowest rent growth metros is slightly higher at $1,527 per month.
The average vacancy rate for the high rent growth metros is 5.4 percent compared to 7.3 percent for the low rent growth rate metros. The average rent growth since February 2020, before COVID struck, is 22.6 percent for the high rent growth metros versus 19.1 percent for the others.
The complete Apartment List report covers many more metros in addition to city, county and state data. It also provides readers with the opportunity to download their data sets. The latest report can be found here.


