

The latest rent report from Apartment List shows that the national median monthly rent growth in October was -0.7 percent. Year-over-year rent growth was -1.2 percent.
Apartment List reported the national median apartment rent to be $1,354, down $9 from last month’s figure.
Visualizing the data
The first chart shows the history of the national median rent level since 2017. It is plotted year-by-year so that the annual change pattern is visible.
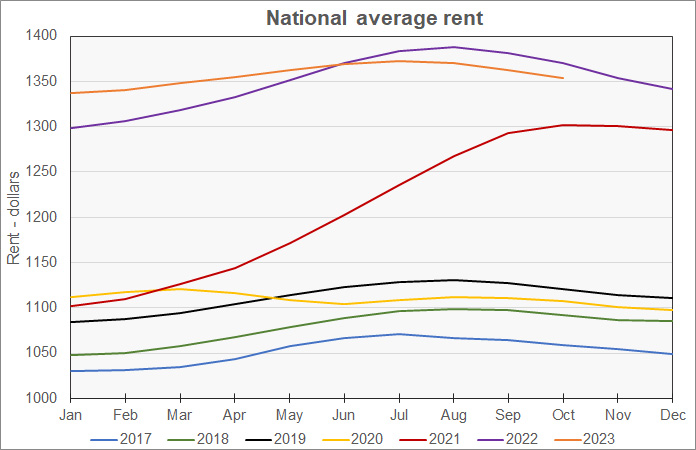
The chart shows that rent growth has been more muted this year after two years of exceptionally strong performance. However, the typical pattern of rents rising in the spring and falling later in the year has been maintained, unlike in the pandemic year of 2020.
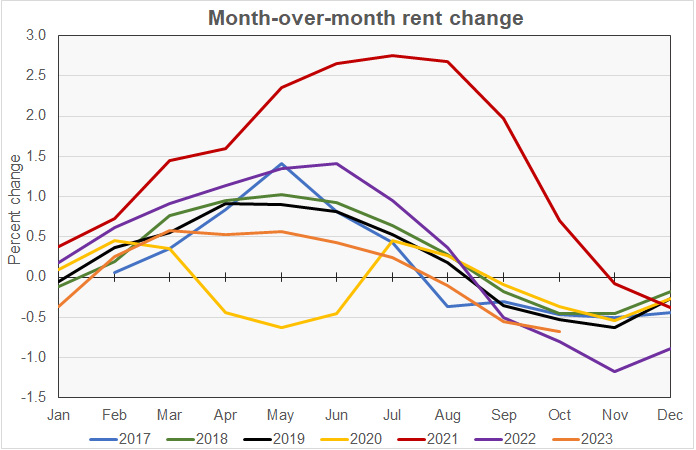
The next chart shows the month-over-month rent growth rate for the Apartment List data set. The chart shows that month-over-month rent growth for 2023 has been some of the lowest in the Apartment List dataset. Since April, 2023 rent growth has either been the lowest in the Apartment List data set or the second-to-lowest.
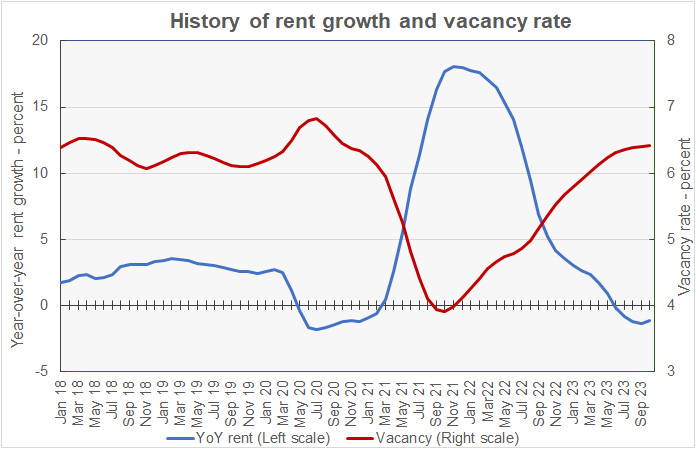
The final chart shows the year-over-year rate of rent growth since January 2018 plotted along with the national median apartment vacancy rate. The chart shows that the current vacancy rate is 6.4 percent, fractionally higher than the average from 2108 and 2019. The October vacancy rate is nearly unchanged from last month’s level. Year-over-year rent growth remained negative at -1.2 percent, but this was slightly less negative than last month’s reading.
Leaders and trailers
Apartment List provides the underlying data they collected in compiling their report and that data was used to create the tables, below. The tables look at the 50 most populous metropolitan statistical areas defined by the US Census Bureau and identify the top and bottom 10 metros for year-over-year rent growth. The tables provide the median monthly rent in the metro, the metro’s vacancy rate, the annual percentage change in rent (YoY Metro) along with the percentage change from the prior month’s rent level (MoM Metro). They also list the percentage changes in rent for the metro areas compared to the rent levels in February 2020, right before the pandemic struck (Feb 20).
The first table shows the 10 metros with the largest annual percentage rent increases. Once again, the list is dominated by older “rust belt” cities.
| Metro | Metro Rent | Vacancy | YoY Metro | MoM Metro | Feb 20 |
| Milwaukee | $949 | 6.3 | 4.2 | (0.11) | 21.4 |
| Providence | $1,164 | 4.6 | 3.8 | (0.91) | 33.2 |
| Chicago | $1,244 | 5.4 | 3.4 | (0.64) | 20.0 |
| Louisville | $902 | 6.1 | 3.0 | (0.26) | 22.6 |
| Grand Rapids | $978 | 5.9 | 2.4 | (1.11) | 30.7 |
| Kansas City | $1,040 | 6.2 | 2.4 | (0.59) | 22.6 |
| Hartford | $1,253 | 5.3 | 2.3 | (1.77) | 27.3 |
| Boston | $1,645 | 5.2 | 2.2 | (1.02) | 18.9 |
| New York | $1,915 | 4.4 | 2.0 | (0.93) | 20.1 |
| Indianapolis | $998 | 6.0 | 1.7 | 0.02 | 29.6 |
The next table shows the 10 metros with the smallest annual rent increases.
| Metro | Metro Rent | Vacancy | YoY Metro | MoM Metro | Feb 20 |
| Austin | $1,392 | 8.6 | (6.3) | (1.52) | 18.8 |
| Portland | $1,313 | 6.5 | (5.2) | (0.82) | 13.3 |
| Phoenix | $1,243 | 6.8 | (4.4) | (0.84) | 27.1 |
| Salt Lake City | $1,187 | 7.8 | (4.3) | (0.87) | 25.7 |
| Atlanta | $1,327 | 7.0 | (4.2) | (0.92) | 23.4 |
| San Francisco | $1,860 | 5.6 | (4.0) | (0.92) | (4.4) |
| Raleigh | $1,330 | 7.6 | (3.9) | (1.17) | 27.9 |
| Las Vegas | $1,154 | 6.7 | (3.6) | (0.43) | 27.9 |
| Orlando | $1,347 | 6.7 | (3.6) | (0.90) | 26.7 |
| Jacksonville | $1,170 | 6.5 | (3.3) | (0.73) | 28.9 |
In October, 30 of the 50 most populous metros saw their rents decline on a year-over-year basis. In addition, 47 of the metros saw rents decline on a month-over-month basis. San Francisco remains the only top-50 metro that still has rents that are below their level in February 2020, immediately before the pandemic.
The average rent in the 10 metros with the highest rent growth is $1,209 per month, while the average rent charged in the 10 lowest rent growth metros is 10 percent higher at $1,332 per month.
The average vacancy rate for the high rent growth metros is 5.5 percent compared to 7.0 percent for the low rent growth rate metros. The average rent growth since February 2020, before COVID struck, is 24.6 percent for the high rent growth metros versus 21.5 percent for the others.
The complete Apartment List report covers many more metros in addition to providing city, county and state data. It also provides readers with the opportunity to download their data sets. The latest report can be found here.


