

The latest commercial property price report from MSCI Real Capital Analytics said that multifamily property prices in November were down 0.7 percent from their level of the month before and down 12.1 percent from their level of one year before. Both of these rates of decline are smaller than those reported last month.
Defining CPPI
MSCI tracks an index called the Commercial Property Price Index (CPPI). The index is computed based on the resale prices of properties whose earlier sales prices and sales dates are known. The index represents the relative change in the price of property over time rather than its absolute price. Note that, as new properties are added to the MSCI dataset each month, they recalculate the CPPI all the way back to the beginning of the data series.
Apartment prices continue fall
The first chart, below, shows how the CPPI’s for all commercial property as a single asset class and for apartments have changed since January 2016. To simplify the comparison, both CPPI’s have been normalized to values of 100 in January 2012. The chart also contains trend lines showing the straight-line average rates of price appreciation for the two asset classes based on their performances from January 2012 to December 2019.
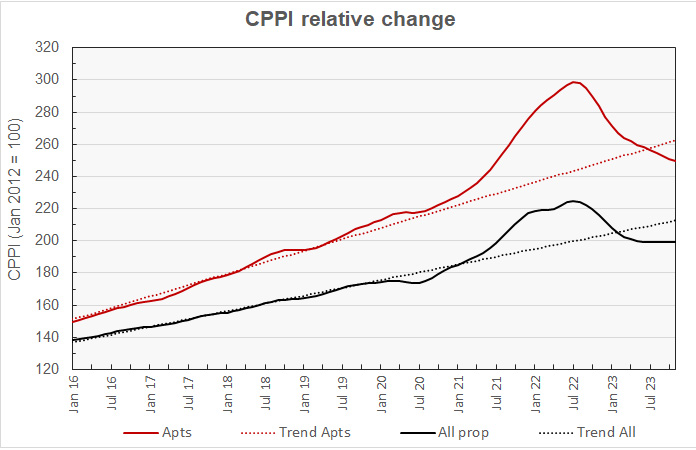
The chart shows that multifamily property price surge during the pandemic is a thing of the past. Prices have been falling since July 2022 and continued to fall this month. Prices dropped below their long-term trend in July 2023 and the gap to the trend has widened since then. Multifamily property prices are now 5.0 percent below their long-term trend, although they remain 17.0 percent above their level in January 2020.
Prices for all commercial property as a single asset class fell below their long-term trend in February and have also continued to fall further behind since then despite not falling in absolute value since July 2023. As of November, they are 6.5 percent below their long-term trend. Prices for all commercial property as a single asset are 14.0 percent above their level in January 2020.
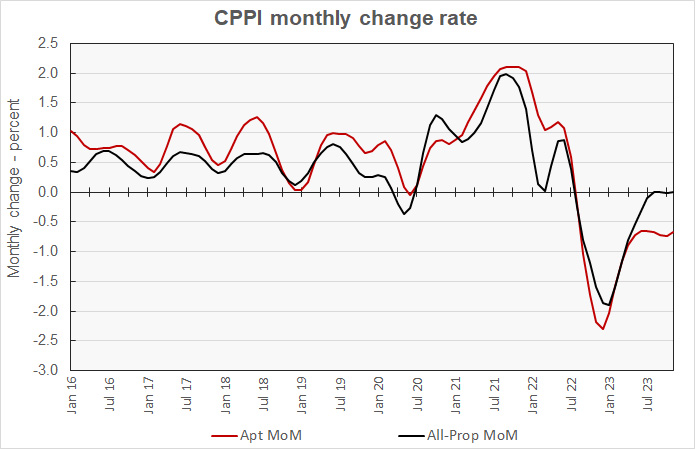
The next chart plots the month-over-month changes in the values of the CPPI since January 2016 for all commercial property as a single asset class and for apartments. The chart shows that, based on current data, the rate that multifamily property prices are falling has plateaued in recent months. In addition, prices for all commercial property as a single asset class have remined relatively stable for the last three months.
As noted above, as more transaction data is collected, the various CPPI’s are recalculated for earlier months. The resulting revisions to the multifamily price data was especially pronounced again this month. The revisions are illustrated in the next chart, which zooms in on the CPPI month-over-month change data since January 2022 as reported this month and last month for the two asset classes we’ve been discussing.
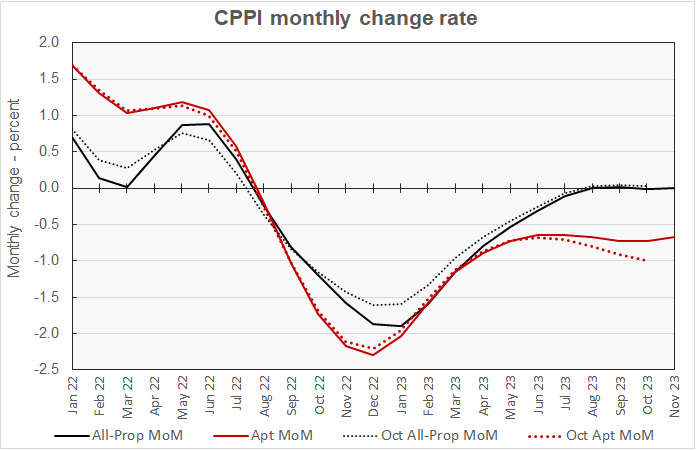
The chart shows that the revisions to the all-property CPPI were significant and extend over the entire time period shown. This may reflect a change in the data collection methodology and particularly the effect of that change on the valuations of offices within CBDs. This is discussed below.
The changes to the multifamily property CPPI were also significant but tended to show up mostly in the data for the last few months. The chart shows that the revisions indicate that the recent decline in multifamily property prices is not as severe as was indicated by last month’s data.
Tracking the rest
On a month-over-month basis, the industrial property class was again the only one to see prices rise in November, with a gain of 0.9 percent. Prices for office properties within central business districts (CBDs) fell 1.5 percent for the month while prices for suburban offices fell by 0.6 percent. Prices for retail property fell 0.3 percent.
Industrial property was again the best performing on a year-over-year basis, managing a gain of 1.8 percent. Prices for offices within CBDs were down 26.0 percent while prices for suburban offices fell 12.4 percent. Prices for retail property were down 6.7 percent.
Careful readers of this report will note that the drops in office prices are MUCH larger than those reported last month. For offices within CBD’s the year-over-year drop is 3.9 times larger than the 6.7 percent decline reported last month, while for suburban offices, the drop is 30 percent larger. The MSCI Real Capital Analytics report includes a note which states, “We have adjusted the transaction filtering process of the RCA CPPI to better reflect the slide in property prices in this down cycle.” The revision had a big influence on the reported results for certain market segments.
Commercial property prices remain below trend
The MSCI report provides data comparing the price changes of commercial property in 6 major metro* areas against those in the rest of the country, although it does not separate out apartments from other commercial property types in this comparison. The next chart, below, plots the history of the relative price indexes since January 2016 for both market segments, along with trend lines based on straight-line fits to the changes in these indexes between January 2012 and December 2019. For purposes of this chart, both price indexes were set to a value of 100 for January 2012.
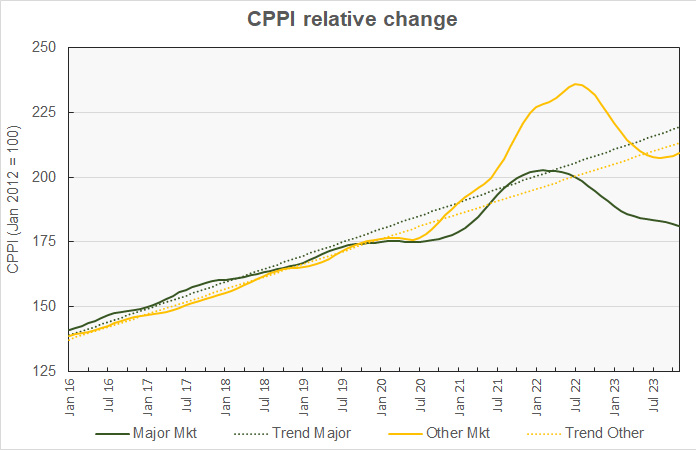
The chart shows that prices of commercial property in the 6 major metros has been hard hit, particularly when compared to the previous trend. The CPPI for major metro commercial property is now 17.3 percent below its long-term trend. By contrast, the CPPI for property in other markets is now less than 1.9 percent below trend.
The final chart plots the history of the month-over-month changes in the price indexes for the two property markets since January 2016. The chart shows that month-over-month price appreciation for major markets is now negative and trending downward. Last month’s report has indicated a small month-over-month price gain for these markets, so revisions to the data collection method have change the story for these metros.
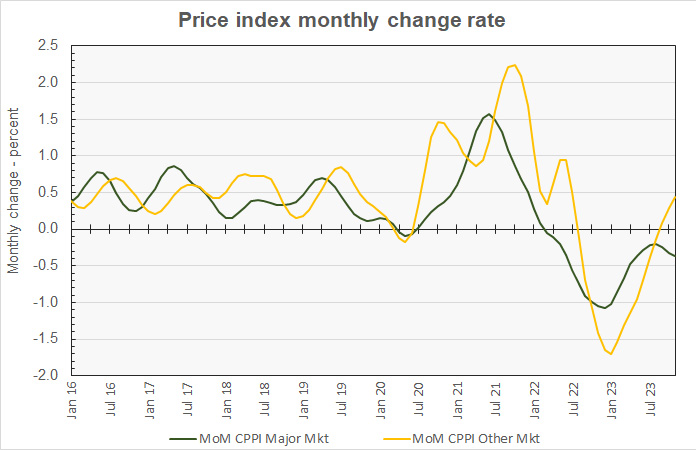
The chart shows that price appreciation for the other metros has been positive, and increasingly so, for the last 3 months. Again, this is very different than the results reported last month where the data showed that price appreciation was improving, but only just approaching positive territory.
By the numbers, price appreciation for commercial property in major metros was reported to be -0.4 percent for the month and -5.9 percent for the year. Price appreciation for commercial property in non-major markets was reported to be +0.4 percent month-over-month and -8.4 percent year-over-year.
The full report provides more detail on other commercial property types. Access to the MSCI report can be obtained here.
*The major metros are Boston, Chicago, Los Angeles, New York, San Francisco and Washington DC.


