

Yardi Matrix reported that national average apartment rent fell $6 in November, compared to the revised rent level of the month before. The average rent fell to $1,713 per month. The national average year-over-year apartment asking rent growth was 0.4 percent in November, the same rate as reported last month.
Rents in the “lifestyle” asset class, usually Class A properties, were down 1.1 percent year-over-year, while rents in “renter by necessity” (RBN) properties increased by 2.0 percent year-over-year. The chart, below, shows the history of the year-over-year rent growth rates for these two asset classes along with the difference between these rates.
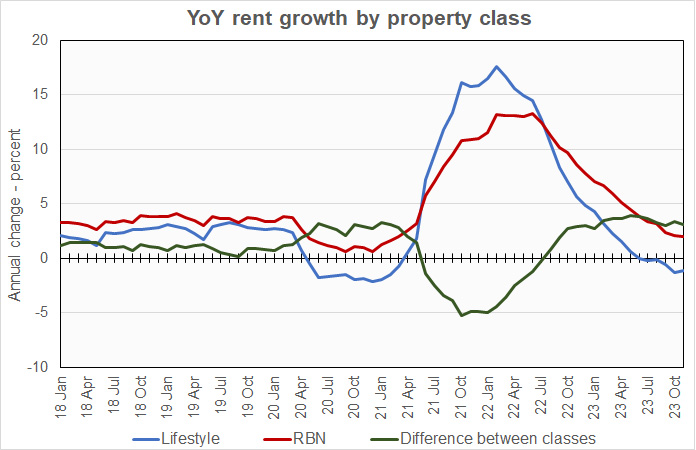
The chart shows that the year-over-year rent growth rates for lifestyle properties is 0.2 percentage points less negative than that reported last month. However, the year-over-year rent growth rate for RBN properties fell slightly during the month. While the spread between the rent growth rates for the two property classes narrowed slightly, it remains much wider than before the pandemic.
The national average lease renewal rate was 65.2 percent in September. Local rates of lease renewal varied from a high of 81.5 percent in New Jersey to a low of 47.4 percent in Los Angeles. Year-over-year rent growth for leases that were renewed was 6.0 percent in September, up 0.1 percentage point from last month’s rate.
Yardi Matrix reported that the national average occupancy rate was unchanged in November at 94.9 percent. However, the report noted that, of the 30 metros for which it reports specific data, again only four saw occupancy rise during the month. This month, those metros were Chicago, Denver, Seattle and Washington D.C.
Yardi Matrix also reported that single-family rental (SFR) rents fell $8 in November to $2,115 per month. The year-over-year SFR rent growth rate fell to 0.7 percent. Of the 34 metros covered in the report, 19 saw rents rise year-over-year.
The national occupancy rate for single-family rentals in November was unchanged from the level of the month before at 95.9 percent.
Tabulating stats
Yardi Matrix reports on other key rental market metrics in addition to rent growth. These include the average rent to income ratio, the rent growth rate for residents who renew their leases and the portion of residents who renew. The metro averages are included in the tables below, but the report also includes the rent to income ratios for both lifestyle and for RBN properties.
Of the Yardi Matrix 30 metros, the 10 with the largest annual apartment rent increases are listed in the table below, along with their annual percentage rent changes, overall rent to income ratio, rent growth for renewed leases and renewal rate for the month. The data on asking rent growth and rent-to-income ratios are for November. The other data are for September.
| Metro | YoY asking rent growth % | Rent to income ratio % | YoY renewal rent growth % | Monthly lease renewal rate % |
| New York | 6.2 | 31.4 | 8.2 | 66.5 |
| Kansas City | 4.0 | 25.3 | 6.9 | 67.7 |
| New Jersey | 4.0 | 33.3 | 6.8 | 81.5 |
| Columbus | 3.4 | 27.2 | 6.3 | 67.4 |
| Chicago | 3.2 | 29.4 | 6.0 | 66.6 |
| Boston | 2.8 | 31.7 | 7.4 | 65.6 |
| Indianapolis | 2.3 | 26.7 | 7.2 | 67.9 |
| Philadelphia | 2.0 | 30.5 | 6.1 | 78.3 |
| San Diego | 1.5 | 33.8 | 8.0 | 57.0 |
| Washington DC | 1.5 | 35.5 | 4.4 | 60.4 |
Yardi Matrix reports most of its statistics for New Jersey for the state as-a-whole. However, it reports rent-to-income data for Northern New Jersey and for Central New Jersey as separate locales. The rent-to-income value for New Jersey listed above is the average of the Northern and Central values.
The major metros with the smallest year-over-year apartment rent growth as determined by Yardi Matrix are listed in the next table, below, along with the other data as in the table above.
| Metro | YoY asking rent growth % | Rent to income ratio % | YoY renewal rent growth % | Monthly lease renewal rate % |
| Austin | (5.6) | 25.9 | 3.9 | 58.4 |
| Phoenix | (3.7) | 28.6 | 2.6 | 59.8 |
| Portland | (3.6) | 31.7 | 7.6 | 62.8 |
| Raleigh | (3.3) | 27.3 | 6.2 | 64.7 |
| Las Vegas | (3.2) | 28.6 | 7.0 | 62.0 |
| Orlando | (3.1) | 32.3 | 9.1 | 65.8 |
| Atlanta | (3.0) | 28.1 | 5.1 | 65.2 |
| Seattle | (2.3) | 30.4 | 5.1 | 60.2 |
| Nashville | (2.2) | 32.0 | 6.0 | 61.3 |
| San Francisco | (2.2) | 32.5 | 2.5 | 52.6 |
The top metros for month-over month rent growth in November were Kansas City, New York City, Houston and Detroit. The metros with the lowest month-over-month rent growth were Raleigh, Seattle, Orlando and Las Vegas.
The future of multifamily
The discussion section in this month’s report put the limited recent rent growth seen in the context of the large increase in rents that has been seen since COVID arrived. It reviewed how post-COVID rent growth has been greatest in secondary markets and suburbs. Rent growth has been slowest in core urban areas. It noted that slow recent rent growth has sometimes been the result of high levels of new supply arriving in particular markets. However, it noted that there is still more demand for housing than there is supply so the long-term prospects for multifamily housing are good.
The report did note that properties that traded recently under aggressive yield assumptions with short-term financing may come under pressure in the near term due to the recent sharp rise in interest rates.
SFR markets
Yardi Matrix reported on the top 34 metros for single family rentals. The leading metros for year-over-year rent growth were Orange County, Kansas City, Toledo and Nashville.
This month, 18 of the metros saw year-over-year occupancy increases, up from 17 last month. The three metros with the largest year-over-year occupancy increases were Las Vegas, Indianapolis, Washington D.C. and Tampa. The metros with the greatest occupancy declines were Philadelphia, Lansing, Orlando and San Antonio.
The complete Yardi Matrix report provides information on some of the smaller multifamily housing markets. It also has more information about the larger multifamily markets including numbers on job growth and on completions of new units. It can be found here.


