

Yardi Matrix reported that national average apartment rents fell $3 in October, compared to the revised rent level of the month before. The average rent fell to $1,718 per month. The national average asking apartment year-over-year rent growth was 0.4 percent in October. This rate of increase was down 0.4 percentage points from that reported last month.
Rents in the “lifestyle” asset class, usually Class A properties, were down 1.3 percent year-over-year, while rents in “renter by necessity” (RBN) properties increased by 2.1 percent year-over-year. The chart, below, shows the history of the year-over-year rent growth rates for these two asset classes along with the difference between these rates.
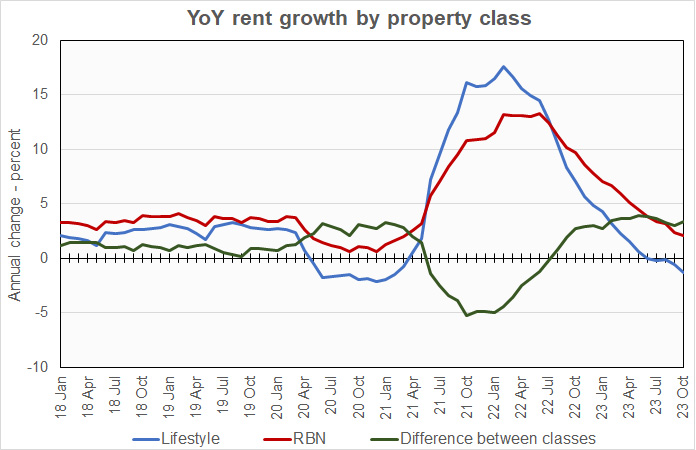
The chart shows that the year-over-year rent growth rates for both lifestyle properties and RBN properties fell during the month. However, the spread between the rent growth rates for the two property classes remained near the mid-point of the range that it has occupied for the last year.
The national average lease renewal rate was 64.4 percent in August. Local rates of lease renewal varied from a high of 81.3 percent in New Jersey to a low of 48.2 percent in San Francisco. Year-over-year rent growth for leases that were renewed was 5.9 percent in August, down from the 6.4 percent lease renewal rent growth rate for July and the 7.8 percent growth rate for June.
Yardi Matrix reported that U.S. average occupancy rate ticked lower in October to 94.9 percent. However, the report noted that, of the 30 metros for which it reports specific data, only Chicago, Denver, New York and Seattle saw occupancy rise during the month.
Yardi Matrix also reported that single-family rental (SFR) rents fell $4 in October to $2,121 per month. The year-over-year SFR rent growth rate fell to 1.0 percent. Of the 34 metros tracked, 19 saw rents rise year-over-year.
The national occupancy rate for single-family rentals in October was unchanged from the revised level of the month before at 95.9 percent.
Tabulating stats
Yardi Matrix reports on other key rental market metrics in addition to rent growth. These include the average rent to income ratio, the rent growth rate for residents who renew their leases and the portion of residents who do renew. The metro averages are included in the tables below, but the report also includes the rent to income ratios for both lifestyle and for RBN properties.
Of the Yardi Matrix 30 metros, the 10 with the largest annual apartment rent increases are listed in the table below, along with their annual percentage rent changes, overall rent to income ratio, rent growth for renewed leases and renewal rate for the month. The data on asking rent growth and rent-to-income ratios are for October. The other data are for August.
| Metro | YoY asking rent growth % | Rent to income ratio % | YoY renewal rent growth % | Monthly lease renewal rate % |
| New York | 5.8 | 32.4 | 11.0 | 65.0 |
| New Jersey | 4.1 | 31.0 | 7.2 | 81.3 |
| Columbus | 3.5 | 27.0 | 5.8 | 67.5 |
| Chicago | 3.2 | 29.5 | 6.6 | 65.1 |
| Kansas City | 3.0 | 26.4 | 8.5 | 67.5 |
| Indianapolis | 2.9 | 25.3 | 8.6 | 67.0 |
| Boston | 2.3 | 28.9 | 9.2 | 64.1 |
| Philadelphia | 2.1 | 31.0 | 6.5 | 77.1 |
| Twin Cities | 1.2 | 29.5 | 3.2 | 64.2 |
| Washington DC | 1.2 | 35.3 | 5.7 | 60.2 |
Yardi Matrix reports most of its statistics for New Jersey for the state as-a-whole. However, it reports rent-to-income data for Northern New Jersey and for Central New Jersey as separate locales. The rent-to-income value for New Jersey listed above is the average of the Northern and Central values.
The major metros with the smallest year-over-year apartment rent growth as determined by Yardi Matrix are listed in the next table, below, along with the other data as in the table above.
| Metro | YoY asking rent growth % | Rent to income ratio % | YoY renewal rent growth % | Monthly lease renewal rate % |
| Austin | (5.6) | 26.2 | 6.0 | 57.7 |
| Phoenix | (3.8) | 28.9 | 3.5 | 59.1 |
| Atlanta | (3.7) | 28.8 | 5.7 | 64.4 |
| Portland | (3.6) | 30.4 | 7.5 | 60.4 |
| Las Vegas | (3.1) | 28.3 | 6.5 | 62.5 |
| Orlando | (2.7) | 31.7 | 7.6 | 65.3 |
| Raleigh | (2.7) | 27.1 | 7.5 | 63.8 |
| Seattle | (2.2) | 29.9 | 4.4 | 59.0 |
| Nashville | (2.0) | 30.8 | 6.5 | 59.4 |
| San Francisco | (2.0) | 29.5 | (5.0) | 48.2 |
The top metros for month-over month rent growth in October were Kansas City, New Jersey, New York City and Detroit. The metros with the lowest month-over-month rent growth were Austin, Orlando, Atlanta and Phoenix.
Looking ahead to the economy
The discussion section of this month’s report talked about the state of the economy and its impact on housing. The surprisingly strong advance estimate of U.S. Q3 GDP from the Bureau of Economic Analysis and the Federal Reserve’s driving up interest rates are setting up cross-currents in the economy.
While the construction pipeline for multifamily units is currently near record highs, high interest rates are likely to suppress construction going forward. Yardi Matrix anticipates that 1.5 million new units will be delivered between 2023 and 2025. Rent growth is expected to be under pressure in locales where ample new supply is coming. However, the dearth of follow-on supply after 2025 should help bring supply and demand back into balance.
SFR markets update
Yardi Matrix reported on the top 34 metros for single family rentals. This month, 19 of the 34 metros covered saw positive year-over-year rent growth. The leading metros for year-over-year rent growth were Nashville, Orange County and Kansas City.
This month, 17 of the metros saw year-over-year occupancy increases, up from 12 last month. The three metros with the largest year-over-year occupancy increases were Las Vegas, Seattle and Indianapolis. The metros with the greatest occupancy declines were Lansing, Orlando and Philadelphia.
The complete Yardi Matrix report provides information on some of the smaller multifamily housing markets. It also has more information about the larger multifamily markets including numbers on job growth and on completions of new units. It includes charts showing the history of rent changes in 18 of the top 30 markets over the last 4 years. It can be found here.


