

Yardi Matrix reported that national average apartment rents fell $6 in September, compared to the revised rent level of the month before. The average rent fell to $1,722 per month. The national average asking apartment year-over-year rent growth was 0.8 percent in September. This rate of increase was down 0.7 percentage points from that reported last month.
Rents in the “lifestyle” asset class, usually Class A properties, were down 0.6 percent year-over-year, while rents in “renter by necessity” (RBN) properties increased by 2.4 percent year-over-year. The chart, below, shows the history of the year-over-year rent growth rates for these two asset classes along with the difference between these rates.
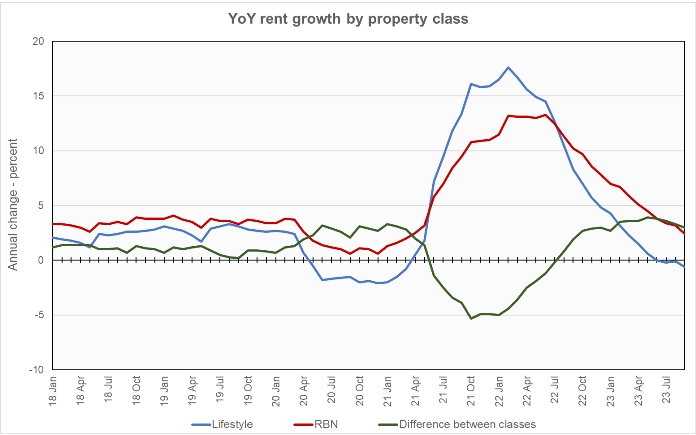
The chart shows that the year-over-year rent growth for lifestyle properties resumed its decline after a pause last month. In addition, the rent growth rate for RBN properties fell by 0.3 percentage points, continuing its steady decline since June 2022. The spread between the rent growth rates for the two property classes decreased again, although it remains well above its pre-COVID level.
The national average lease renewal rate was 60.4 percent in August. This is down 2.5 percentage points from the 62.9 percent lease renewal rate seen in July but up from the 59.4 percent rate seen in June. Year-over-year rent growth for leases that were renewed was 6.4 percent in August, down from the 7.9 percent lease renewal rent growth rate for July and the 8.1 percent growth rate for June.
Yardi Matrix reported that U.S. average occupancy rate was unchanged again in September at 95.0 percent. The report noted that, of the 30 metros for which it reports specific data, only Chicago, Boston, and Denver saw occupancy rise during the month.
Yardi Matrix also reported that single-family rental (SFR) rents fell $4 in September to $2,104 per month. The year-over-year SFR rent growth rate fell to 0.4 percent. Of the 34 metros tracked in the report, 16 saw rents rise year-over-year.
The national occupancy rate for single-family rentals in September was unchanged from the revised level of the month before at 95.9 percent.
Tabulating stats
Yardi Matrix reports on other key rental market metrics in addition to rent growth. These include the average rent to income ratio, the rent growth rate for residents who renew their leases and the portion of residents who do renew. The metro averages are included in the tables below, but the report also includes the rent to income ratios for both lifestyle and for RBN properties.
Of the Yardi Matrix 30 metros, the 10 with the largest annual apartment rent increases are listed in the table below, along with their annual percentage rent changes, overall rent to income ratio, rent growth for renewed leases and renewal rate for the month. The data on asking rent growth are for September. The other data are for August.
| Metro | YoY asking rent growth % | Rent to income ratio % | YoY renewal rent growth % | Monthly lease renewal rate % |
| New York | 5.6 | 32.4 | 3.8 | 65.4 |
| New Jersey | 5.2 | 30.4 | 5.9 | 80.7 |
| Chicago | 4.0 | 28.8 | 6.7 | 64.7 |
| Indianapolis | 3.8 | 25.6 | 8.8 | 67.2 |
| Kansas City | 3.6 | 24.7 | 8.0 | 67.0 |
| Boston | 3.1 | 27.7 | 8.9 | 65.3 |
| Columbus | 2.7 | 27.6 | 5.5 | 65.3 |
| Philadelphia | 2.4 | 31.1 | 7.1 | 76.2 |
| San Diego | 1.9 | 38.9 | 7.5 | 55.4 |
| Miami Metro | 1.8 | 28.0 | 10.3 | 65.9 |
Yardi Matrix reports most of its statistics for New Jersey for the state as-a-whole. However, it reports rent-to-income data for Northern New Jersey and for Central New Jersey as separate locales. The rent-to-income value for New Jersey listed above is the average of the Northern and Central values.
The major metros with the smallest year-over-year apartment rent growth as determined by Yardi Matrix are listed in the next table, below, along with the other data as in the table above.
| Metro | YoY asking rent growth % | Rent to income ratio % | YoY renewal rent growth % | Monthly lease renewal rate % |
| Austin | (4.5) | 26.1 | 7.5 | 56.8 |
| Phoenix | (3.1) | 29.2 | 4.2 | 55.7 |
| Las Vegas | (2.7) | 28.6 | 6.3 | 60.7 |
| Atlanta | (2.5) | 29.3 | 6.7 | 63.2 |
| Portland | (2.4) | 29.6 | 6.7 | 60.3 |
| Seattle | (2.4) | 30.3 | 5.6 | 58.2 |
| San Francisco | (1.7) | 33.5 | 3.3 | 49.7 |
| Orlando | (1.5) | 31.8 | 8.7 | 63.8 |
| Raleigh | (1.5) | 27.4 | 9.9 | 61.9 |
| Nashville | (1.4) | 30.8 | 7.1 | 59.4 |
The top metros for month-over month rent growth in September were New Jersey, Miami, Twin Cities and Kansas City. Only Kansas City was in the top 4 last month. The metros with the lowest month-over-month rent growth were San Diego, Boston, Austin and Tampa. Only Austin was in the bottom 4 last month. The high level of turnover in these lists shows the volatility of this data.
Segmenting the market
The discussion section of this month’s report talked about the factors driving the difference in rent growth between different metros. It suggested that the metros could be broadly classed into three groups.
One group is metros in the Northeast and Midwest which may have lower growth rates than other metros, but which also have much lower levels of new supply. This keeps supply and demand in balance and supports healthy rent growth.
A second group is fast-growing tech hubs. These have a high level of new supply arriving but growth which has slowed as the pandemic-era in-migration has also slowed. Rents here will remain under pressure until the new supply is absorbed.
The third group are the west coast and New York markets where operations are under pressure from high and increasing regulatory burdens. These markets have flat or negative year-over-year rent growth.
SFR market status
Yardi Matrix reported on the top 34 metros for single family rentals. This month, 16 of the 34 metros covered saw positive year-over-year rent growth. The leading metros for year-over-year rent growth were Chicago, Nashville and Philadelphia.
This month, 12 of the metros saw year-over-year occupancy increases, the same as last month’s count. The three metros with the largest year-over-year occupancy increases were Las Vegas, Seattle and Indianapolis. The metros with the greatest occupancy declines were Washington D.C, Austin and Philadelphia.
The complete Yardi Matrix report provides information on some of the smaller multifamily housing markets. It also has more information about the larger multifamily markets including numbers on job growth and on completions of new units. It includes charts showing the history of rent changes in 18 of the top 30 markets over the last 4 years. It can be found here.


