

The producer price index (PPI) report from the Bureau of Labor Statistics (BLS) stated that construction materials prices were up 0.2 percent month-over-month in October on a seasonally adjusted basis. In addition, last month’s price change was revised upward by 0.1 percentage point to 0.3 percent. The price index of components and materials for construction was up 0.6 percent from its year-earlier level.
Overall prices for processed goods for intermediate demand fell by 0.9 percent in the month. The decline was largely due to a 4.5 percent fall in the index for processed fuels and lubricants. The processed goods for intermediate demand index was 4.5 percent lower than its year-earlier level.
For reference, the changes in these indices compare with a 3.2 percent rise in the all-items consumer price index (CPI-U) for the 12 months ending in October. The seasonally adjusted October CPI-U was unchanged from August’s level. Energy prices were down 2.5 percent for the month and were down 4.5 percent year-over-year. The shelter portion of the CPI-U was up 0.3 percent for the month and was 6.7 percent higher than its year-ago level. Rent of primary residence was up 0.5 percent for the month and 7.2 percent for the year.
Yield Pro compiled the BLS reported changes for our standard list of construction materials prices. These are prices of materials which directly impact the cost of constructing an apartment building. The two right hand columns of the table provide the percent change in the price of the commodity from a year earlier (12 Mo PC Change) and the percent change in price from September (1 Mo PC Change). If no price data is available for a given commodity, the change is listed as N/A.
The pre-COVID column lists the change in the current construction materials prices relative to the average of prices from December 2019 through February 2020, before the pandemic impacted the economy. This may give a truer idea of the magnitude of the recent price increases for materials, such as lumber, whose prices were already rising sharply last year, than does the 12 Mo PC Change column.
| Commodity | 12 Mo PC Change | 1 Mo PC Change | Pre-covid Change |
| Softwood lumber | (16.3) | (3.2) | 13.6 |
| Hardwood lumber | (5.7) | 1.1 | 23.7 |
| General millworks | (1.0) | 0.3 | 28.1 |
| Soft plywood products | (5.6) | 1.9 | 77.5 |
| Hot rolled steel bars, plates and structural shapes | (10.3) | (1.2) | 53.4 |
| Copper wire and cable | 2.7 | (1.3) | 26.8 |
| Power wire and cable | 39.8 | 9.1 | 136.8 |
| Builder’s hardware | 0.9 | 0.0 | 25.5 |
| Plumbing fixtures and fittings | 1.7 | 0.0 | 17.7 |
| Enameled iron and metal sanitary ware | 0.9 | 2.5 | 21.5 |
| Furnaces and heaters | 3.7 | 1.9 | 36.8 |
| Sheet metal products | (1.2) | 0.0 | 46.3 |
| Electrical Lighting fixtures | 0.4 | 0.0 | 18.1 |
| Nails | (17.2) | (5.5) | 23.3 |
| Major appliances | 1.9 | 0.1 | 22.3 |
| Flat glass | (6.2) | 0.5 | 29.2 |
| Ready mix concrete | 11.3 | 0.1 | 33.6 |
| Asphalt roofing and siding | 3.9 | 0.7 | 40.8 |
| Gypsum products | (1.2) | (0.0) | 41.1 |
| Mineral wool insulation | (0.6) | (0.3) | 39.6 |
The first chart, below, shows the price index history for wood products over the past 37 months. Note that the prices used by the BLS in compiling the indexes are collected on the Tuesday of the week containing the 13th day of the month. In October that would have been October 10. In the November report, the data collection date will be November 14.
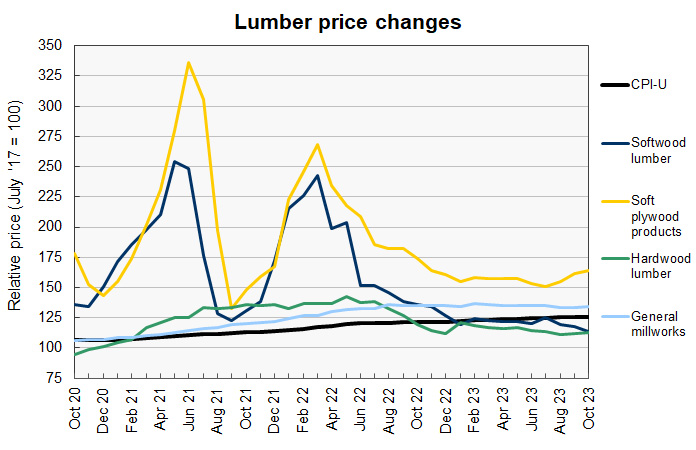
The prices for most wood products continued to be relatively stable in October. The softwood lumber price index was reported to fall by 3.2 percent, one of the larger price declines seen in this month’s data. The soft plywood price index was reported to rise only 1.9 percent in October, but this was on top of an upward adjustment of 3.4 percent for the index for the month before. This is the second month in a row where the size of the gains in plywood prices was masked by upward revisions to the earlier data.
Looking ahead, NASDAQ reported that the market price of lumber closed on October 10 at $501 and rose to $529 on November 14. Between those dates, prices were as low as $480 and as high as $540. Lumber prices in the futures markets seem to signal short-term price stability. The January 2024 contract closed on November 14 at $530, while the May 2024 contract closed at $552.
The next chart, below, shows the recent history of several other construction materials prices. These are relatively simple commodities whose prices are strongly driven by those of the materials of which they are comprised.
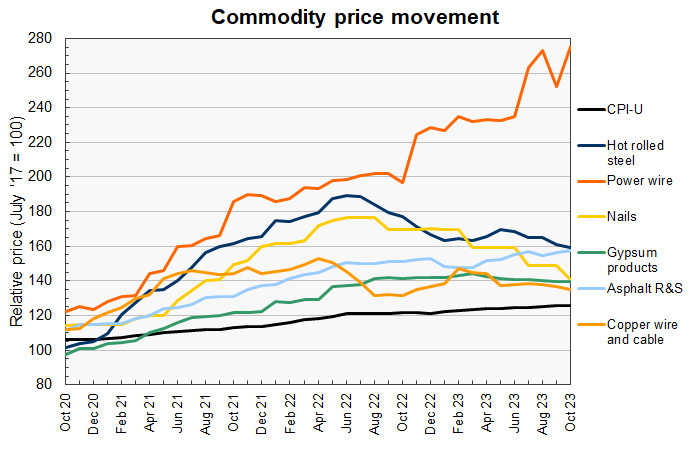
Power wire and cable prices have by far the highest increases year-over-year and since the start of the pandemic of any of the construction materials prices we track, and its lead expanded this month with a jump of 9.1 percent. However, the reported price for this commodity has been very volatile lately. After months of relative stability, it leapt higher in July and higher still in August. It then took a big drop in September before rebounding in October to a level only 0.9 percent above August’s level.
The construction materials prices for most of the other commodities in this grouping have been trending lower lately. The exception to this is asphalt roofing and siding. Its price index has been rising steadily. It now has the fourth highest post-COVID increase of the construction materials prices we track.
Looking ahead at prices for underlying materials, MarketWatch reported that the NYSE American steel index fell through mid-October but has been trending up recently. It closed at $1,896 on October 10 and closed at $1,990 on November 14. Meanwhile, steel futures surged starting in mid-October. The January contract closed 32 percent higher on November 14 than it did on October 10. However, on November 14, the May 2024 contract closed 16 percent lower than did the January contract so the market is predicting that steel prices will peak early in the year and then decline gradually.
The price of copper closed at $3.68 per pound on November 14 down $0.05 since October 10. It had closed as high as $3.72 per pound and as low as $3.56 per pound between those dates.
The price of aluminum staged something of a rebound in late October. It closed on November 14 at $2,235, up $13 from its level on October 10. However, it had spiked as high as $2,287 in early November.
Price changes for several of the more finished goods from our sample are illustrated in the final chart, below.
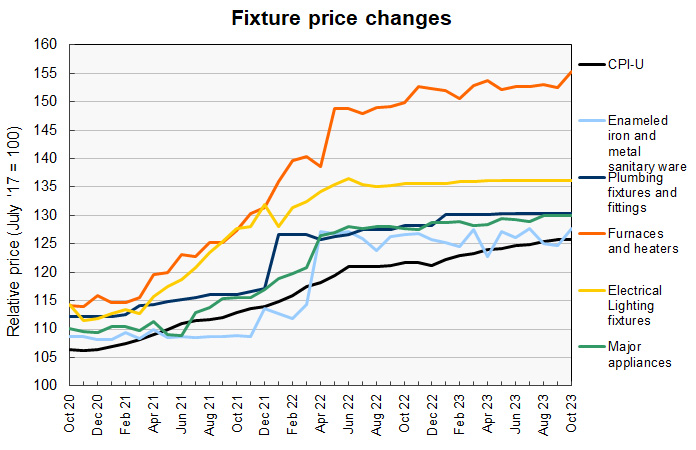
There are odd things happening with the data regarding many of these construction materials prices.
For the second month in a row, the monthly construction materials price index for enameled iron and metal sanitary ware was reported to rise by over 2 percent. However, the reported index is exactly unchanged from the preliminary value in the prior month’s report and the “rise” is entirely due to the prior month’s value being revised lower. This also happened last month so the preliminary reported price index for this commodity has been unchanged for 3 months.
There are other construction materials price indexes that have been suspiciously stable recently. The index for builder’s hardware has been reported to be the exact same value since April. The index for plumbing fixtures has been reported to be the exact same value since May. The index for electrical lighting fixtures has changed only in the last digit of a 6-digit number since June.
Just variations in data sampling from month to month would be expected to cause more variation than this.
The price index for furnaces and heaters rose by 1.9 percent this month on top of a 0.4 percent upward revision to the prior month’s index value. The year-over-year rise in the index is relatively low, but this is because its strong upward movement occurred more than a year ago. Its post-COVID increase is the 8th highest of the 20 construction material prices we track.
The full current BLS report can be found here.


