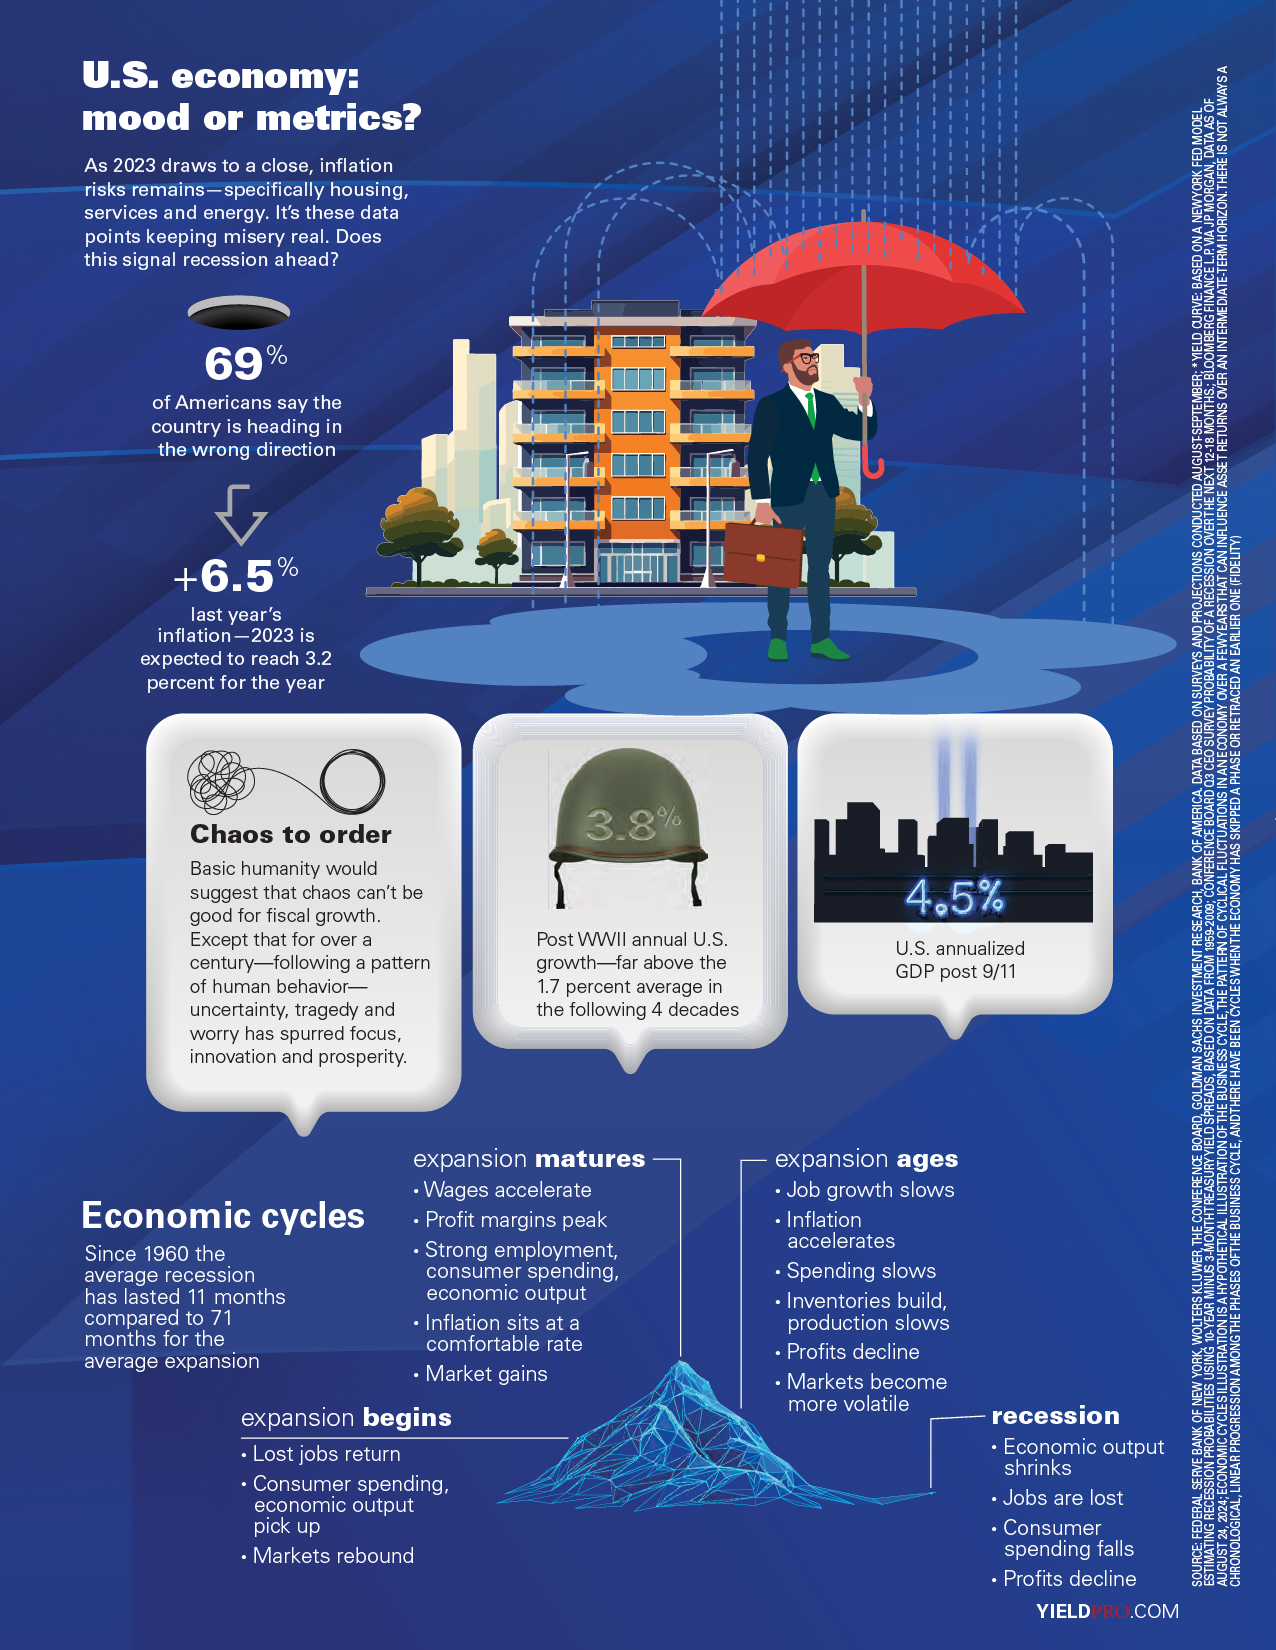
 As 2023 draws to a close, inflation risks remains—specifically housing, services and energy. It’s these data points keeping misery real. Does this signal recession ahead?
69% of Americans say the country is heading in the wrong direction
+6.5% last year’s inflation—2023 is expected to reach 3.2 percent for the year
Chaos to order Basic humanity would suggest that chaos can’t be good for fiscal growth. Except that for over a century—following a pattern of human behavior—uncertainty, tragedy and worry has spurred focus, innovation and prosperity.
3.8%
Post WWII annual U.S. growth—far above the 1.7 percent average in the following 4 decades
4.5%
U.S. annualized GDP post 9/11
Economic cycles
Since 1960 the average recession has lasted 11 months compared to 71 months for the average expansion
expansion begins
• Lost jobs return • Consumer spending, economic output pick up • Markets rebound
expansion matures
• Wages accelerate • Profit margins peak • Strong employment, consumer spending, economic output • Inflation sits at a comfortable rate • Market gains
expansion ages
• Job growth slows • Inflation accelerates • Spending slows • Inventories build, production slows • Profits decline • Markets become more volatile
recession
• Economic output shrinks • Jobs are lost • Consumer spending falls • Profits decline
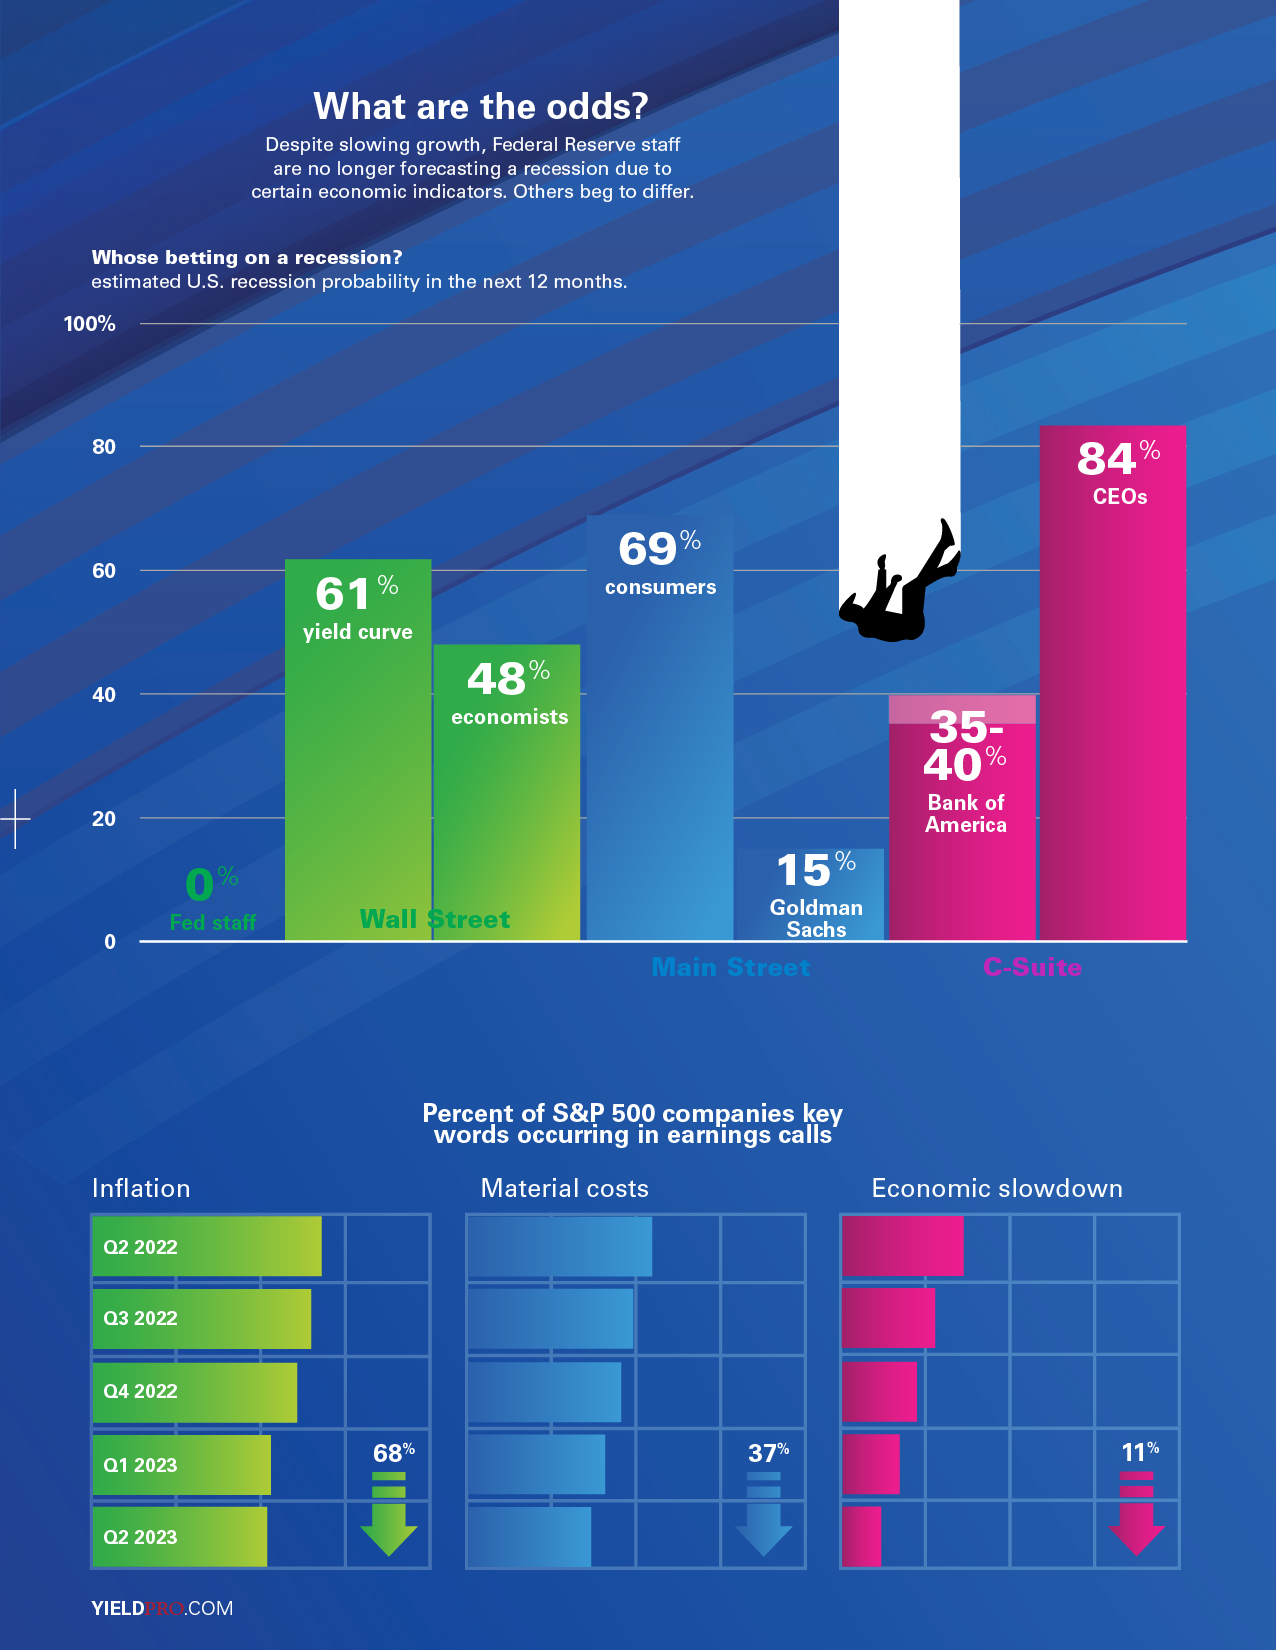
What are the odds?
Despite slowing growth, Federal Reserve staff are no longer forecasting a recession due to certain economic indicators. Others beg to differ.
Whose betting on a recession? estimated U.S. recession probability in the next 12 months.
0% Fed staff
Wall Street
61% yield curve
Main Street
48% economists
69% consumers
15% Goldman Sachs
C-Suite
35-40% Bank of America
84% CEOs
Percent of S&P 500 companies key words occurring in earnings calls
Inflation 68%
Material costs 37%
Economic slowdown 11%
SOURCE: FEDERAL SERVE BANK OF NEW YORK, WOLTERS KLUWER, THE CONFERENCE BOARD, GOLDMAN SACHS INVESTMENT RESEARCH, BANK OF AMERICA. DATA BASED ON SURVEYS AND PROJECTIONS CONDUCTED AUGUST-SEPTEMBER; YIELD CURVE: BASED ON A NEW YORK FED MODEL ESTIMATING RECESSION PROBABILITIES USING 10-YEAR MINUS 3-MONTH TREASURY YIELD SPREADS, BASED ON DATA FROM 1959-2009; CONFERENCE BOARD Q3 CEO SURVEY PROBABILITY OF A RECESSION OVER THE NEXT 12-18 MONTHS.; BLOOMBERG FINANCE L.P. VIA JP MORGAN, DATA AS OF AUGUST 24, 2024; ECONOMIC CYCLES ILLUSTRATION IS A HYPOTHETICAL ILLUSTRATION OF THE BUSINESS CYCLE, THE PATTERN OF CYCLICAL FLUCTUATIONS IN AN ECONOMY OVER A FEW YEARS THAT CAN INFLUENCE ASSET RETURNS OVER AN INTERMEDIATE-TERM HORIZON. THERE IS NOT ALWAYS A CHRONOLOGICAL, LINEAR PROGRESSION AMONG THE PHASES OF THE BUSINESS CYCLE, AND THERE HAVE BEEN CYCLES WHEN THE ECONOMY HAS SKIPPED A PHASE OR RETRACED AN EARLIER ONE (FIDELITY)