

The Employment Situation Report from the Bureau of Labor Statistics stated that December employment levels in 3 of the 4 multifamily-related job categories we track rose from the revised levels of the previous month.
Overall employment growth accelerates
The Bureau of Labor Statistics (BLS) reported that total seasonally-adjusted non-farm employment increased by 219,000 jobs in December to 157,087,000 jobs, based on their survey of business establishments. This compares to revised employment gains of 173,000 jobs in November and 105,000 in October. In this month’s report, the November employment gain was revised lower by 26,000 jobs while the October employment gain was revised lower by 45,000 jobs from that reported last month.
The BLS household survey reported that the US unemployment rate was unchanged at 3.7 percent. The household survey found that the number of employed persons fell by 683,000 from that reported last month to 161,183,000. The number of unemployed persons rose by 6,000 to 6,268,000.
The household survey also found that the number of people in the civilian labor force fell by 676,000 in December while the adult civilian population rose by 169,000. The labor force participation rate fell 0.3 percentage points to 62.5 percent. It had been at 63.4 percent before the pandemic. Recovering that 0.9 percent decline in the labor force participation rate would bring 2.41 million more people into the workforce.
Tracking multifamily employment
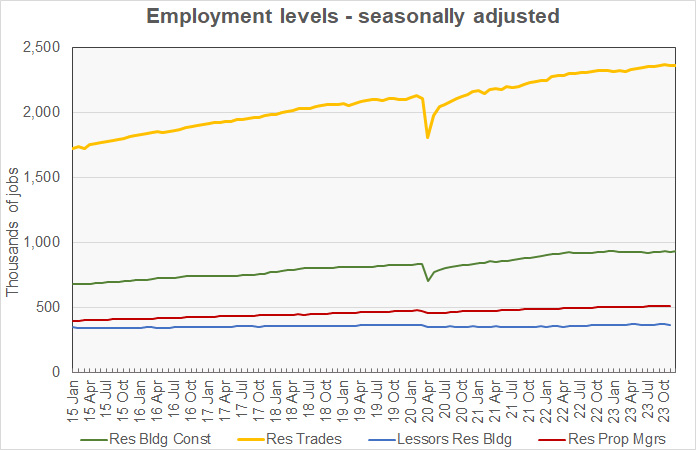
The BLS reported more detailed employment information on four job categories of interest to the multifamily industry. These are employment as residential construction workers, as specialty trades within residential construction, as residential property managers and as lessors of residential buildings. As usual, some of the data is reported with a month delay, so the latest figures for the latter two categories are for the month of November.
The first chart shows the history of the levels of employment in these four jobs categories since 2015.
Residential construction employment reported higher
Employment in residential building construction in December, usually with general contractors, was reported to be up by 3,900 jobs. This was aided by a downward revision of the prior month’s employment level of 1,500 jobs. Employment in this category is now 936,100 jobs, up 0.2 percent year-over-year.
Employment in residential building trades, i.e. plumbers, electricians, etc., in December was reported to be up by 1,600 jobs from November’s revised (-8,700 jobs) level. Employment in this category is now 2,363,100 jobs. Employment in December is up 1.7 percent year-over-year.
Note that the initial employment level for the trades job category reported in October was 2,372,800 jobs. Despite the BLS reporting employment increases in this category in both the November and December jobs reports, employment is now reported to be 9,700 jobs less than the initial report for October. This is because of downward revisions to the October and November jobs figures in subsequent reports.
Total October employment in these two categories of residential construction jobs combined is up 0.2 percent from the revised level of the month before and up 1.2 percent year-over-year. It is down 0.1 percent from the preliminary level for November contained in last month’s report.
Apartment operations jobs up for the month
Employment for residential property managers in November was reported to be up by 2,600 jobs from its revised (-300 jobs) level for October to 516,300 jobs. Employment for residential property managers is up 2.2 percent year-over-year.
Employment for lessors of residential buildings in November was reported to fall by 100 jobs from its level for October to 371,900 jobs. Employment in this category is up 1.2 percent year-over-year.
Total employment in these two categories of apartment operations jobs combined was reported to be up 0.3 percent from the revised level for last month. It is up 1.8 percent year-over-year.
Growth below trend
The final chart, below, presents the employment data in a different format. It normalizes the employment levels in all four jobs categories to a reading of 100 for January 2015. It also provides trend lines for the growth in each of the categories of employment based on the period from January 2015 through February 2020.
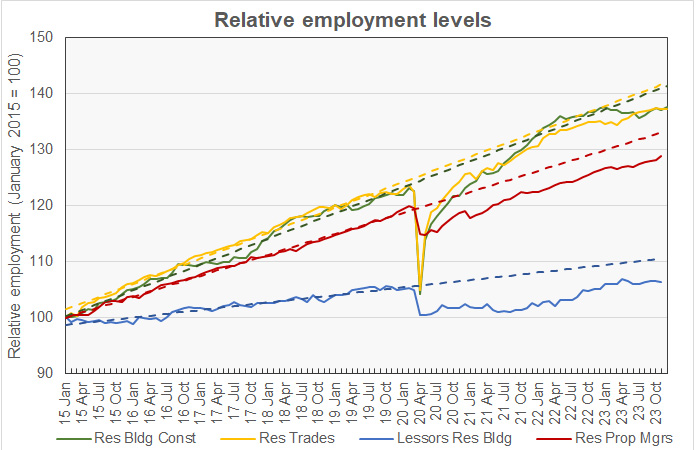
The chart shows that employment in the two property management categories has seemingly settled into trends that are running below their pre-pandemic levels. This may indicate that efficiency measures, such as offering self-guided tours, has reduced staffing needs for apartment operators. The chart also shows that construction employment recovered to near its pre-pandemic trend by early 2022, but growth has lately plateaued as high interest rates put a damper on new construction.
Residential building construction employment is now 2.6 percent below trend. Residential trades employment is now 3.3 percent below trend. Residential property managers employment is 3.2 percent below trend and lessors of residential buildings employment is now 3.7 percent below trend.
The numbers given in the Employment Situation report are seasonally adjusted and are subject to revision. It is common for small adjustments to be made in subsequent reports, particularly to the data for the most recent month. The current Employment Situation report can be found here.


