

Yardi Matrix reported that national average apartment rents fell $4 in December, compared to the level of the month before. The average rent fell to $1,709 per month. The national average year-over-year apartment asking rent growth was 0.3 percent in December, down 0.1 percent from the rate reported last month.
Rents in the “lifestyle” asset class, usually Class A properties, were down 1.1 percent year-over-year, while rents in “renter by necessity” (RBN) properties increased by 1.9 percent year-over-year. The chart, below, shows the history of the year-over-year rent growth rates for these two asset classes along with the difference between these rates.
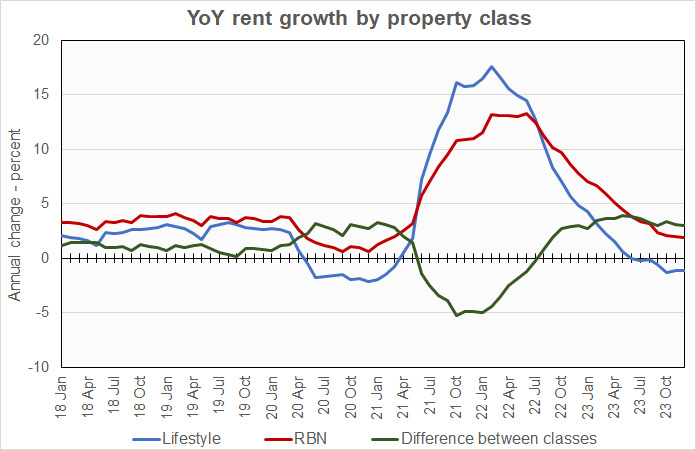
The chart shows that the year-over-year rent growth rate for RBN properties averaged about 1 percent higher than that for lifestyle properties in the two years before the pandemic. Since the pandemic arrived in March 2020, the difference in rent growth rates for the two property classes has deviated widely from that average in both the positive and negative directions. However, we are now at a point where the positive and negative deviations just about offset each other. It will be interesting to see if this milestone will mark a return to the pre-pandemic relationship between the rent growth rates for the two property classes or if the high levels of deliveries in the lifestyle class will continue to result in a higher rent growth rate differential.
The national average lease renewal rate was 64.4 percent in October. New Jersey continued to be the leader in lease renewal rate with 80.8 percent of renters renewing. However, Philadelphia was close behind with a lease renewal rate of 79.8 percent. At the other end of the spectrum, the lease renewal rate was only 45.3 percent in Los Angeles and 49.9 percent in San Francisco.
Year-over-year rent growth for leases that were renewed was 5.2 percent in October, down 0.8 percentage points from last month’s rate. However, individual metros varied significantly from the average. Year-over-year renewal rent growth was as high as 12.4 percent in Las Vegas and as low as 1.0 percent in Phoenix.
Yardi Matrix reported that U.S. average occupancy rate dropped 0.1 percentage point in December to 94.8 percent. In December, 5 of the 30 metros for which it reports specific data saw occupancy rise during the month. Those metros were Chicago, Seattle, Denver, Washington D.C. and the Twin Cities.
Yardi Matrix also reported that single-family rental (SFR) rents fell $1 in December to $2,123 per month. The year-over-year SFR rent growth rate rose to 1.2 percent. Of the 34 SFR markets tracked, 19 saw rents rise year-over-year.
The national occupancy rate for single-family rentals in December fell 0.1 percentage point from the level of the month before to 95.8 percent.
Tabulating stats
Yardi Matrix reports on other key rental market metrics in addition to rent growth. These include the average rent to income ratio, the rent growth rate for residents who renew their leases and the portion of residents who renew. The metro averages are listed in the tables below, but the report also includes the rent to income ratios for both lifestyle and for RBN properties.
Of the Yardi Matrix 30 metros, the 10 with the largest annual apartment rent increases are listed in the table below, along with their annual percentage rent changes, overall rent to income ratio, rent growth for renewed leases and renewal rate for the month. The data on asking rent growth and rent-to-income ratios are for December. The other data are for October.
| Metro | YoY asking rent growth % | Rent to income ratio % | YoY renewal rent growth % | Monthly lease renewal rate % |
| New York | 5.9 | 32.0 | 3.1 | 60.5 |
| New Jersey | 4.2 | 32.0 | 5.5 | 80.8 |
| Columbus | 3.8 | 27.2 | 8.2 | 66.0 |
| Kansas City | 3.3 | 25.3 | 8.1 | 68.1 |
| Chicago | 3.1 | 29.6 | 6.0 | 66.3 |
| Boston | 3.0 | 32.9 | 6.2 | 63.8 |
| Indianapolis | 2.4 | 26.5 | 5.8 | 68.3 |
| Philadelphia | 2.0 | 29.2 | 5.1 | 79.8 |
| Washington DC | 1.6 | 35.4 | 2.7 | 60.7 |
| Detroit | 1.4 | 27.2 | 1.0 | 71.0 |
Yardi Matrix reports most of its statistics for New Jersey for the state as-a-whole. However, it reports rent-to-income data for Northern New Jersey and for Central New Jersey as separate locales. The rent-to-income value for New Jersey listed above is the average of the Northern and Central values.
The major metros with the smallest year-over-year apartment rent growth as determined by Yardi Matrix are listed in the next table, below, along with the other data as in the table above.
| Metro | YoY asking rent growth % | Rent to income ratio % | YoY renewal rent growth % | Monthly lease renewal rate % |
| Austin | (5.7) | 26.9 | 2.9 | 55.5 |
| Orlando | (3.9) | 32.2 | 6.1 | 65.6 |
| Phoenix | (3.8) | 28.0 | 1.0 | 60.2 |
| Portland | (3.8) | 30.9 | 5.1 | 62.4 |
| Las Vegas | (3.0) | 29.2 | 12.4 | 62.5 |
| Raleigh | (2.9) | 26.8 | 5.3 | 63.9 |
| Nashville | (2.7) | 31.4 | 3.6 | 57.7 |
| Atlanta | (2.4) | 29.7 | 4.7 | 64.3 |
| Dallas | (1.8) | 28.1 | 4.0 | 62.3 |
| San Francisco | (1.8) | 30.8 | 2.1 | 49.9 |
The top metros for month-over month rent growth in December were Columbus, New York City, Atlanta and New Jersey. The metros with the lowest month-over-month rent growth were Nashville, Orlando, Dallas and Portland.
SFR markets
Yardi Matrix reported on the top 34 metros for single family rentals. The leading metros for year-over-year rent growth were Orange County, Kansas City, Toledo and Nashville.
This month, 18 of the metros saw year-over-year occupancy increases, up from 17 last month. The three metros with the largest year-over-year occupancy increases were Las Vegas, Indianapolis, Washington D.C. and Tampa. The metros with the greatest occupancy declines were Philadelphia, Lansing, Orlando and San Antonio.
The complete Yardi Matrix report provides information on some of the smaller multifamily housing markets. It also has more information about the larger multifamily markets including numbers on job growth and on completions of new units. It can be found here.


