

The Employment Situation Report from the Bureau of Labor Statistics stated that January employment levels in 3 of the 4 multifamily-related job categories we track rose from the revised levels of the previous month.
Overall employment growth accelerates
As usual for the January report, the Bureau of Labor Statistics (BLS) made adjustments to their population figures based on the latest estimates from the Census Bureau. The adjustments reduced the size of the US population by 625,000, the size of the civilian labor force by 299,000, the number of employed people 270,000, and the number of unemployed people by 28,000. Because of these adjustments, the revisions to last month’s data are sometimes exceptionally large.
The BLS reported that total seasonally-adjusted non-farm employment increased by 353,000 jobs in January to 157,700,000 jobs, based on their survey of business establishments. This compares to a revised employment gain of 333,000 jobs in December, up from the 216,000 jobs gain reported last month.
The BLS household survey reported that the US unemployment rate was unchanged at 3.7 percent. The household survey found that the number of employed persons fell by 31,000 from that reported for last month to 161,152,000. The number of unemployed persons fell by 144,000 to 6,124,000.
The household survey also found that the number of people in the civilian labor force fell by 175,000 in January while the adult civilian population fell by 451,000. The labor force participation rate was unchanged at 62.5 percent. It had been at 63.4 percent before the pandemic. Recovering that 0.9 percent decline in the labor force participation rate would bring 2.41 million more people into the workforce.
Tracking multifamily employment
The BLS reported more detailed employment information on four job categories of interest to the multifamily industry. These are employment in residential construction jobs, as specialty trades within residential construction, as residential property managers and as lessors of residential buildings. As usual, some of the data is reported with a month delay, so the latest figures for the latter two categories are for the month of December.
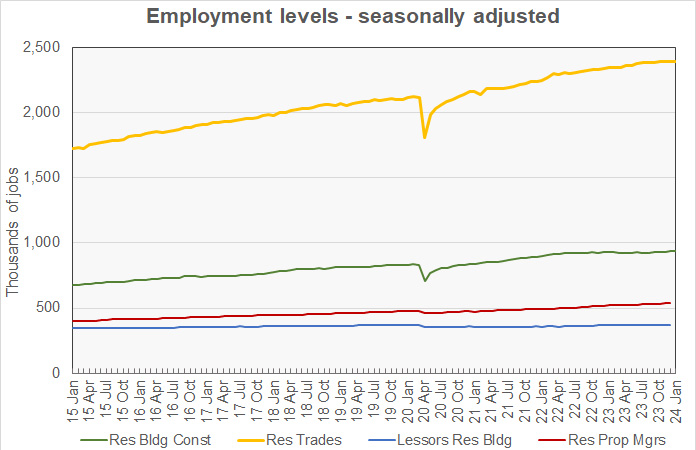
The first chart shows the history of the levels of employment in these four jobs categories since 2015 based on the revised BLS data.
Residential construction employment moves higher
The number of residential building construction jobs in January, usually with general contractors, was reported to be up by 2,500 jobs. This was aided slightly by a downward revision of the prior month’s employment level of 200 jobs. Employment in this category is now 938,400 jobs, up 0.9 percent year-over-year.
Employment in residential building trades, i.e. plumbers, electricians, etc., in January was reported to be up by 200 jobs from December’s level. However, the December jobs figure was revised higher by an extraordinary 31,000 jobs. Employment in this category is now 2,394,300 jobs. Employment in January is up 2.2 percent year-over-year.
Total October employment in these two categories of residential construction jobs combined is up 0.1 percent from the revised level of the month before and up 1.8 percent year-over-year. It is up 1.0 percent from the preliminary level for December contained in last month’s report.
Apartment operations jobs up overall
Employment for residential property managers in December was reported to be up by 3,800 jobs from its greatly revised (+20,500 jobs) level for October to 540,600 jobs. Employment for residential property managers is up 4.3 percent year-over-year.
Employment for lessors of residential buildings in December was reported to fall by 900 jobs from its revised (-600 jobs) level for October to 370,400 jobs. Employment in this category is up 1.2 percent year-over-year.
Total employment in these two categories of apartment operations jobs combined was reported to be up 0.3 percent from the revised level for last month. It is up 3.0 percent year-over-year.
Revised job growth nears pre-pandemic trend
The final chart, below, presents the employment data in a different format. It normalizes the employment levels in all four jobs categories to a reading of 100 for January 2015. It also provides trend lines for the growth in each of the categories of employment based on the period from January 2015 through February 2020.
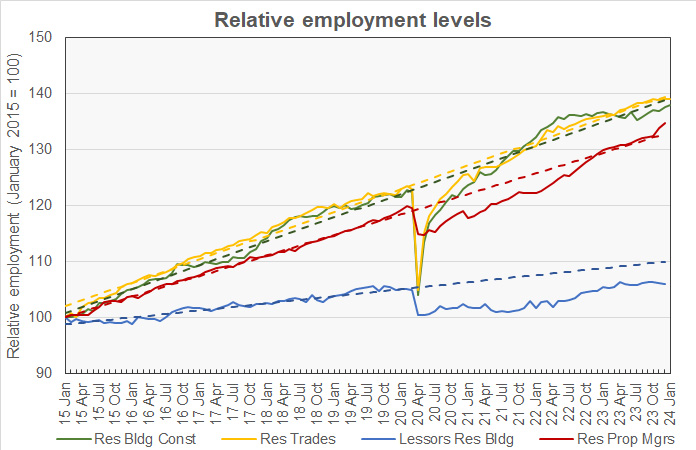
Revisions to the population data made a big difference to the look of this chart, particularly for the last 12 months of data. In last month’s report, employment in all 4 jobs categories was running 2.6 percent or more below their trend lines. The revisions brought the current employment levels much closer to the previous trends for 3 of the 4 jobs categories we track. Only Lessors of Residential Buildings employment remains significantly below trend.
The number of residential building construction jobs is now 0.9 percent below trend. Residential trades employment is now 0.5 percent below trend. Residential property managers employment is 1.5 percent above trend and lessors of residential buildings employment is now 3.7 percent below trend.
The numbers given in the Employment Situation report are seasonally adjusted and are subject to revision. It is common for small adjustments to be made in subsequent reports, particularly to the data for the most recent month. The current Employment Situation report can be found here.


