

CoStar reported that its value-weighted index of multifamily property prices fell 0.4 percent month-over-month in December 2023, the fourth decline in a row. This index was down 10.7 percent year-over-year.
The value-weighted index of non-multifamily commercial property fell 1.4 percent, month-over-month, in December. This index fell 7.5 percent year-over-year. The other commercial property types tracked by CoStar are office, retail, industrial and hospitality.
For more information on the CoStar Commercial Repeat Sales Indexes (CCRSI’s), please see the description at the bottom of this report.
YoY multifamily property prices down
The first chart, below, shows the history of the value-weighted CCRSI’s since January 2016 for multifamily property and for all other commercial property considered as a single asset class. It also shows trend lines for the growth in the two CCRSI’s based on their growth in the period from January 2012 to January 2020. The indexes are normalized so that their values in December 2000 are set to 100.
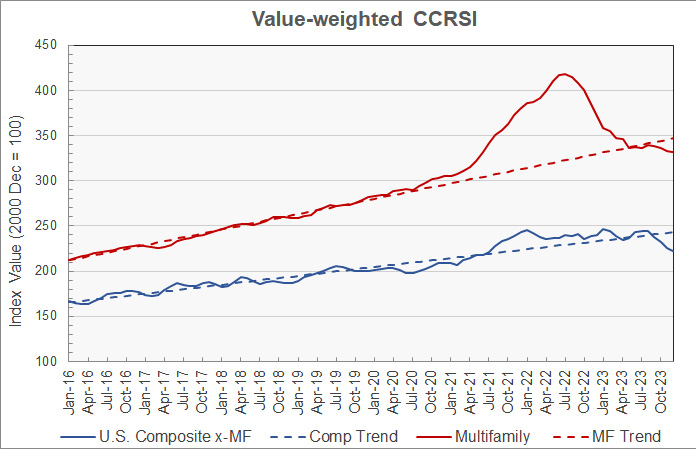
The chart shows that both multifamily property prices and prices for other commercial property types seemed to be returning to their pre-pandemic trends in the summer of 2023. However, they have been dropping significantly below those trends in recent months. In August, multifamily property prices were reported to be within 0.5 percent of their long-term trend but they dropped to 4.3 percent below trend in December. In December, prices for other commercial property types were 8.6 percent below their long-term trend.
The second chart shows the year-over-year change in the value-weighted multifamily property price index and that for all other commercial property types since January 2016. It also shows the average rates of annual price growth for the two property classes since January 2012.
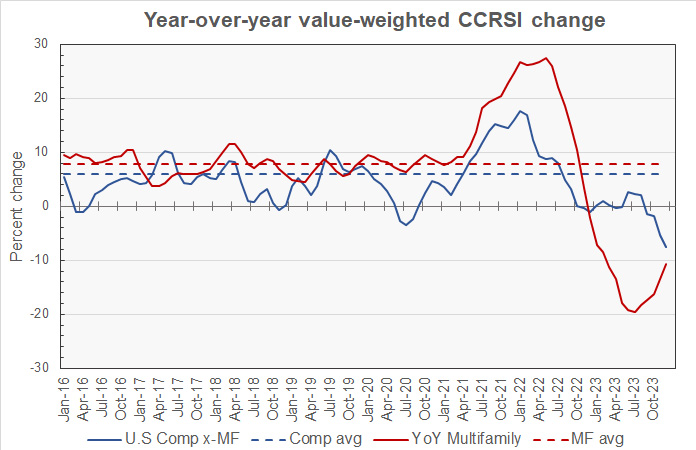
The chart shows that the year-over-year growth in both multifamily and non-multifamily property prices are negative to nearly the same degree but moving in opposite directions. The movement is partly due to multifamily property prices being compared to the elevated COVID-era property prices which still existed one year ago, but which were falling rapidly. One year ago, non-multifamily commercial property prices were much closer to their long-term trend and were rising slightly.
Since January 2012, the average annual increase in multifamily property prices has been 7.8 percent while that of other commercial property prices has been 5.9 percent.
Mixed results by region
CoStar’s quarterly reports include information on changes in the equal-weighted CCRSI by property type by region. The history since Q1 2000 of these regional indexes for multifamily property is shown in the next chart, below.
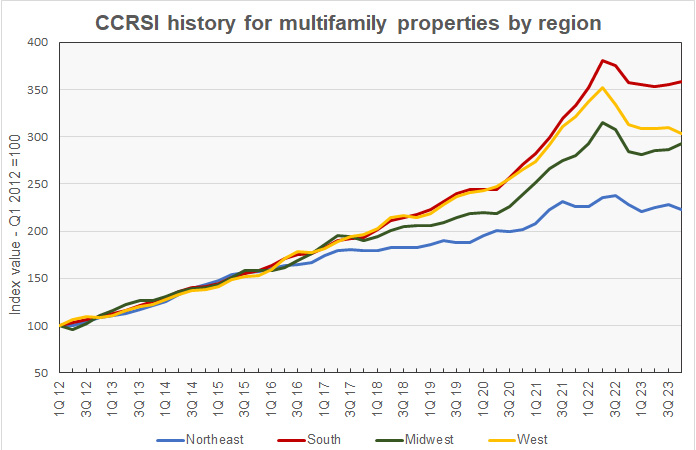
Multifamily property prices in Q4 2023 were below the highs they reached in Q2 or Q3 of 2022 in all four regions of the country. On a quarter-over-quarter basis, prices in Q4 2023 were down by 2.3 percent in the Northeast and 2.0 percent in the West. However, prices rose 0.6 percent in the South and 2.0 percent in the Midwest from their levels in Q3.
While prices in the Northeast region have risen more than those in the other regions since 2000, they have risen at the slowest pace of any of the regions since 2016. Since 2016, the average year-over-year increase in the regional multifamily CCRSI for the Northeast region has been 5.1 percent. The South region has had the highest average rate of price appreciation at 11.8 percent, followed by the West at 10.4 percent and the Midwest at 8.9 percent.
The next chart shows the history of the year-over-year regional multifamily property price changes by quarter since 2016. The chart shows prices had been falling year-over-year in all regions of the country through Q2 2023 but have recently been moving toward positive territory.
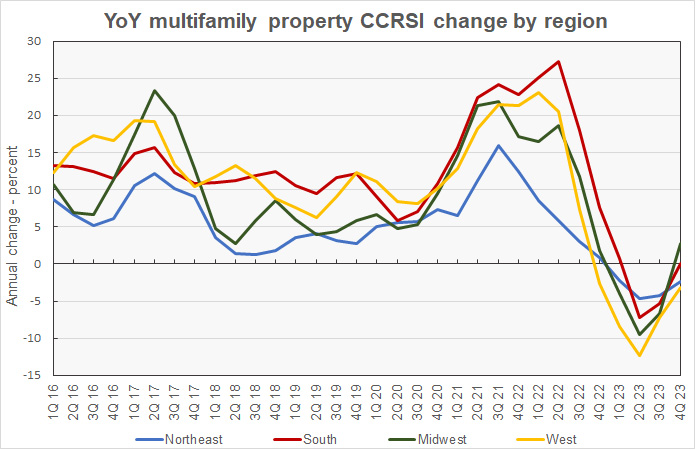
Based on CoStar’s equal-weighted quarterly indexes and comparing to year-earlier levels, prices in Q4 2023 were down by 2.4 percent in the Northeast and 3.1 percent in the West. However, prices rose 0.1 percent in the South and 2.7 percent in the Midwest.
Transaction volumes up
An issue with monthly transaction volume reporting is that CoStar usually identifies additional transactions to tabulate over the next few months after the initial report, and these extra transactions tend to make initial reports of declining transaction volumes worse.
CoStar reported that the initial transaction count for December was up from that of the prior month at 1,178 transactions. In addition, last month’s transaction count was revised higher by 9.6 percent as 101 additional transactions were identified for November. On an initial report to initial report basis, transactions were up 12 percent for the month. However, comparing the transaction count for December to the updated transaction count for November results in an increase of only 2.2 percent.
The preliminary dollar volume of transactions was reported to jump 41 percent from the revised level of the month before at $8.7 billion. It was up 53 percent from the unusually low preliminary level reported last month.
The full report discusses all commercial property types. While the CoStar report provides information on transaction volumes, it does not break out multifamily transactions. The latest CoStar report can be found here.
CCRSI defined
The CoStar report focuses on a relative measure of property prices called the CoStar Commercial Repeat Sales Index (CCRSI). The index is computed based on the resale of properties whose earlier sales prices and sales dates are known. The index represents the relative change in the price of property over time rather than its absolute price. CoStar identified 1,178 repeat sale pairs in December for all property types. These sales pairs were used to calculate the results quoted here.
CoStar computes CCRSI’s for a variety of property groupings, combining them by cost, region, property type or other factors. The value-weighted index is more heavily influenced by transactions of expensive properties than is CoStar’s equal-weighted index. The value-weighted index is the focus of this report because it is an index whose value is reported monthly and for which CoStar breaks out multifamily property as a separate category.


