

CoStar reported that its value-weighted index of multifamily property prices fell 0.6 percent month-over-month in November 2023, a smaller drop than last month’s revised decline of 0.9 percent. This index was down 13.5 percent year-over-year.
The value-weighted index of non-multifamily commercial property fell 1.3 percent, month-over-month, in November. This index fell 3.5 a percent year-over-year. The other commercial property types tracked by CoStar are office, retail, industrial and hospitality.
For more information on the CoStar Commercial Repeat Sales Indexes (CCRSI’s), please see the section at the bottom of this report.
YoY multifamily property prices down
The first chart, below, shows the history of the value-weighted CCRSI’s since January 2016 for multifamily property and for all other commercial property considered as a single asset class. It also shows trend lines for the growth in the two CCRSI’s based on their growth in the period from January 2012 to January 2020. The indexes are normalized so that their values in December 2000 are set to 100.
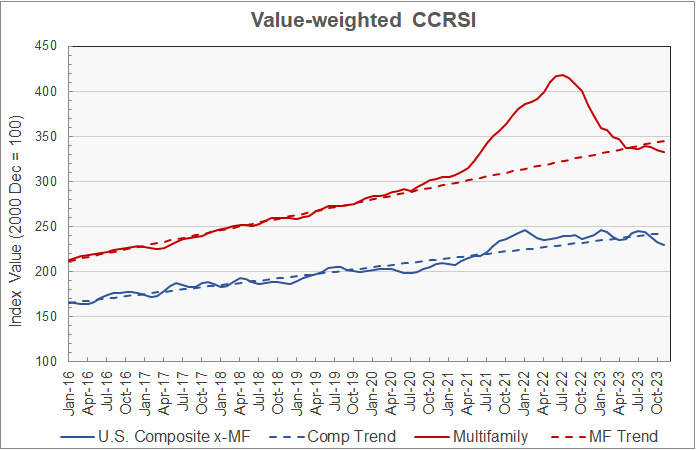
The chart shows that multifamily property prices have come down significantly since reaching a peak in July 2022. They are currently 20.2 percent below that maximum value and are now back to their level in June 2021. Multifamily property prices are now 3.5 percent below the level of their pre-pandemic trend.
The chart also shows that prices for other commercial property did not run up nearly to the degree that did multifamily property prices. Non-multifamily commercial property prices reached their highest level in January 2023, slightly exceeding their earlier high in January 2022. Their prices have not had a clear direction since then, experiencing a mix of up and down months. Prices have now fallen to a level not seen since August 2021 and are 5.3 percent below their pre-pandemic trend.
The report noted that new supply of multifamily units over the last 12 months has exceeded absorption by a ratio of 2 to 1. This has caused the vacancy rate to rise to 7.2 percent according to CoStar, a higher level than that reported by other sources. This has put pressure on property valuations.
The second chart shows the year-over-year change in the value-weighted multifamily property price index and that for all other commercial property types since January 2016. It also shows the average rates of annual price growth for the two property classes since January 2012.
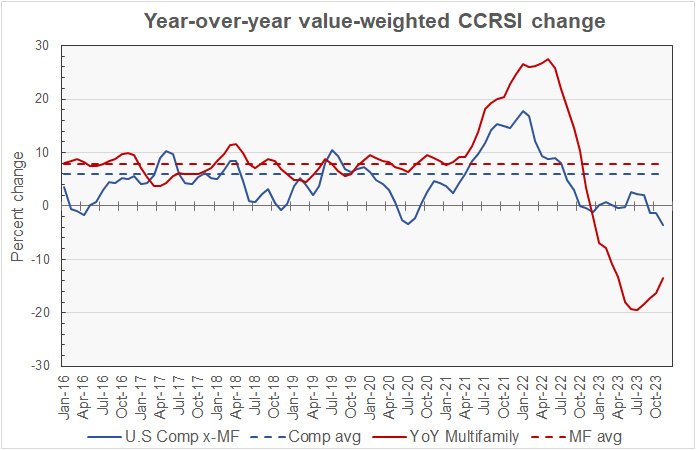
The chart shows how greatly the recent price change history for multifamily properties has deviated from the steady growth in prices of the pre-pandemic period. Currently, prices are declining in absolute terms, but at a slower rate on a year-over-year basis.
Since January 2012, the average annual increase in multifamily property prices has been 7.9 percent while that of other commercial property prices has been 6.0 percent.
Transaction volumes in sharp decline
An issue with monthly transaction volume reporting is that CoStar usually identifies additional transactions to tabulate over the next few months after the initial report and these extra transactions tend to make initial reports of declining transaction volumes worse by comparison. For example, last month’s report indicated that the transaction count for October fell from September’s level. However, after revisions in this month’s report, the transaction count for October is higher than that for September.
CoStar reported that its initial transaction count for November plunged 20.1 percent from the revised level of the prior month at 1,052 transactions. However, last month’s transaction count was revised higher by 12.7 percent as 148 additional transactions were identified for October. On an initial report to initial report basis, transactions were down 9.9 percent for the month.
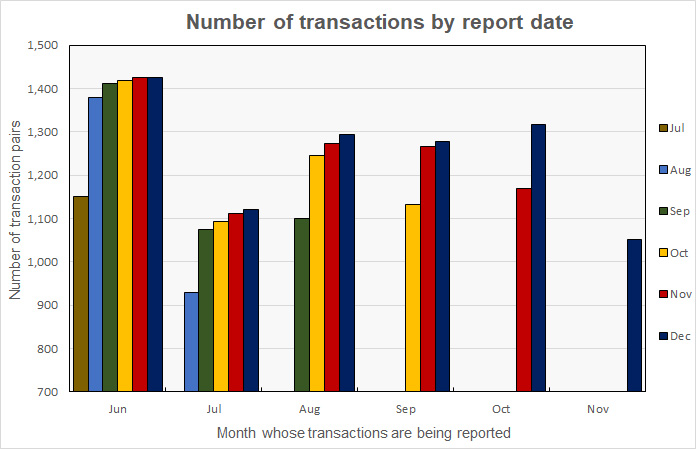
The effect of these revisions is shown in the next chart, below. The cluster of bars at the left side of the chart represent the 6 reports that have been made so far as to the volume of transactions for June 2023. The preliminary volume for June 2023 reported in July was 1,150 transactions. This count was revised to 1,380 transactions in the August report and to 1,412 transactions in the September report. The current (November) report puts the June transaction count at 1,424. The 24 percent additional transactions identified between July and November can change the assessment of how June’s transaction volume stacks up against that of any month to which it is being compared.
The CoStar report noted that the portion of distressed sales rose this month, reaching 2.7 percent. This is up from the 1.5 percent portion reported last month but is well below the levels seen in 2010 when distressed sales routinely made up 30 percent of total sales.
The preliminary dollar volume of transactions was reported to fall 38.6 percent from the revised level of the month before at $5.6 billion. It was down 36.4 percent from the preliminary level reported last month.
The full report discusses all commercial property types. While the CoStar report provides information on transaction volumes, it does not break out multifamily transactions. The latest CoStar report can be found here.
CCRSI defined
The CoStar report focuses on a relative measure of property prices called the CoStar Commercial Repeat Sales Index (CCRSI). The index is computed based on the resale of properties whose earlier sales prices and sales dates are known. The index represents the relative change in the price of property over time rather than its absolute price. CoStar identified 1,052 repeat sale pairs in November for all property types. These sales pairs were used to calculate the results quoted here.
CoStar computes CCRSI’s for a variety of property groupings, combining them by cost, region, property type or other factors. The value-weighted index is more heavily influenced by transactions of expensive properties than is CoStar’s equal-weighted index. The value-weighted index is the focus of this report because it is an index whose value is reported monthly and for which CoStar breaks out multifamily property as a separate category.


