

The Census Bureau’s new residential construction report for February showed multifamily construction unit completions continuing their recent surge. In addition, both multifamily permits and multifamily starts rose from the low levels they reached last month.
The number of multifamily units under construction fell again in February even though January’s figure was revised slightly lower. The number of multifamily units under construction has been declining since July 2023.
The report on single-family housing construction showed that, on a seasonally adjusted basis, single family permits rose 1.0 percent month-over-month and 29.5 percent year-over-year to 1,031,000 units. Starts rebounded 11.6 percent month-over-month while rising 35.2 percent year-over-year to 1,129,000 units. Completions also surged, rising 20.2 percent month-over-month and 4.2 percent year-over-year to 1,072,000 units. The reported number of single-family units under construction rose 2,000 from the revised level of the month before to 683,000 units.
Multifamily housing permits stage comeback
The number of permits issued for buildings with 5 or more units in February was reported to be 429,000 units on a seasonally adjusted, annualized basis. Permit issuance was up 2.4 percent (10,000 units) from January’s revised (+14,000 units) figure. February permits were down 32.8 percent from the level recorded in February 2023 and were also down 13.5 percent from the trailing 12-month average.
In addition, 58,000 permits were issued in February for units in buildings with 2 to 4 units. This was up 9,000 units from the revised (-1,000 units) figure for January. February permits for units in buildings with 2 to 4 units were up 20.8 percent from the year-ago level and were up 13.7 percent from the trailing 12-month average.
Regional data for multifamily housing is only reported for structures with two or more units. “Structures with 5 or more units” is not broken out as a separate category. Since the regional data is highly volatile and is frequently revised, it is examined here based on three-month weighted moving averages. This averaging helps smooth out the month-to-month variations in the data so that underlying trends are more visible.
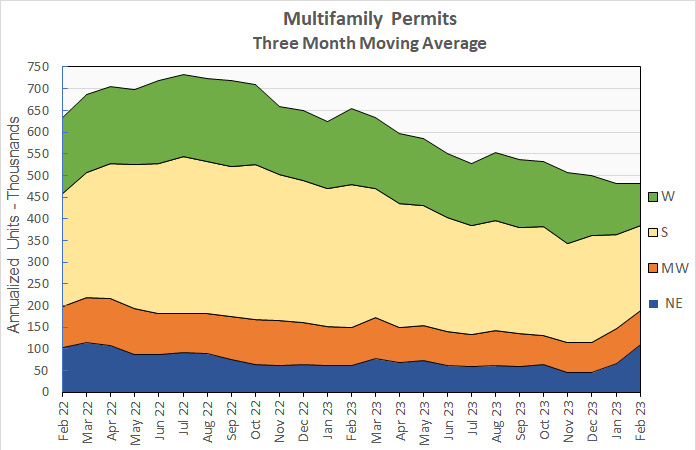
Nationally, the three-month weighted moving average for permits issued for multifamily housing in February was up 0.3 percent from the level in January but was down 26.5 percent from the level of February 2023. The three-month weighted moving average for permits came it at 482,000 annualized units.
On a month-over-month basis, the three-month weighted moving average for multifamily permit issuance was up 67.0 percent in the Northeast. Permit issuance fell 2.9 percent in the Midwest, 9.6 percent in the South and 16.2 percent in the West.
When compared to year-earlier levels, the three-month weighted moving average of permits issued was up 77.0 percent in the Northeast but down in other regions of the country. Permits fell 9.4 percent in the Midwest, 40.7 percent in the South, and 44.2 percent in the West.
The following chart shows the three-month weighted moving averages of permits by region for the last 25 months.
Multifamily housing construction starts rebound
The preliminary February figure for multifamily housing starts in buildings with 5 or more units was 377,000 units on a seasonally adjusted, annualized basis. This was reported to be up 30,000 units from the revised (+33,000 units) figure for January.
Compared to the year-earlier level, multifamily housing starts in buildings with 5 or more units were down 35.9 percent. The reported starts figure was 16.1 percent lower than the trailing 12-month average.
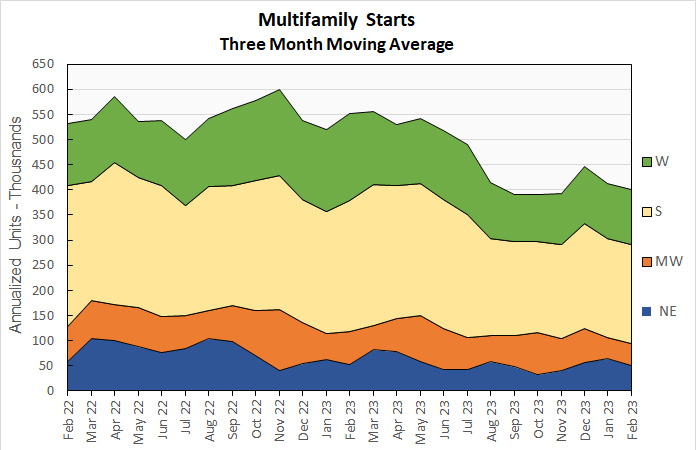
Multifamily housing construction starts (two or more units per building) in February were down 3.0 percent from their January level for the country as-a-whole, based on three-month weighted moving averages. Starts rose 0.4 percent in the South and were effectively unchanged in the Midwest and West. Starts fell 20.5 percent in the Northeast.
The three-month weighted moving average of starts was down 27.4 percent for the country-as-a-whole on a year-over-year basis. Compared to February 2023, starts were down 4.1 percent in the Northeast, 23.8 percent in the South, 34.9 percent in the Midwest and 37.1 percent in the West.
The following chart shows the three-month weighted moving average of starts by region for the last 25 months.
Multifamily housing completions leap higher
The preliminary February multifamily housing unit completions figure in buildings with 5 or more units per building was 644,000 units on a seasonally adjusted, annualized basis. This is the highest level of completions since 1974. Completions were reported to be up 20.8 percent (111,000 units) from January’s revised (-5,000 units) figure.
Compared to the year-earlier level, multifamily housing completions in buildings with 5 or more units per building were up 18.8 percent. Compared to the trailing 12-month average, completions were up 41.0 percent.
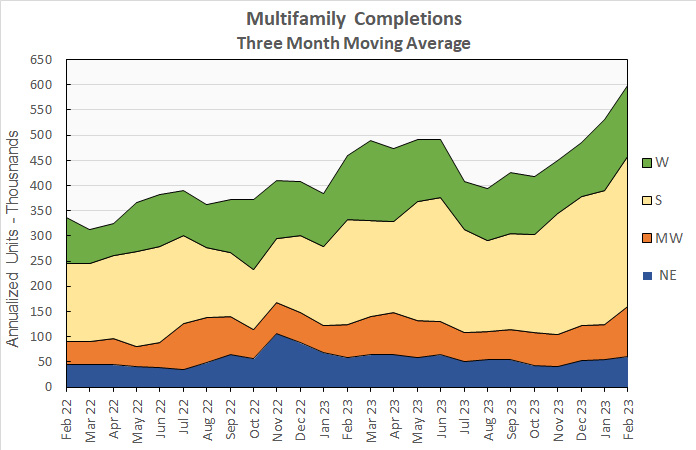
For the country as-a-whole, multifamily housing construction completions (two or more units per building) were up 13.0 percent month-over-month, comparing three-month weighted moving averages. The three-month weighted moving average of completions was up 41.9 percent in the Midwest, 12.5 percent in the South, 9.7 percent in the Northeast and 0.9 percent in the West.
On a year-over-year basis, the three-month weighted moving average of completions in buildings with 2 or more units per building was up 30.4 percent nationally. Completions were up 50.5 percent in the Midwest, 42.2 percent in the South, 12.0 percent in the West and 4.6 percent in the Northeast.
The three-month weighted moving average of completions by region for the past 25 months are shown in the chart below.
The number of multifamily units reported to be under construction fell in February. Census reported that there were 966,000 units under construction in buildings with 5 or more units per building on a seasonally adjusted annualized basis. This was reported to be down by 10,000 units from the revised (-3,000 units) level of the month before. It is 2.4 percent, or 23,000 units, higher than the number of units under construction one year earlier.
All data quoted are based on seasonally adjusted results and are subject to revision.


