

A Mortgage Bankers Association (MBA) report shows that the growth in multifamily mortgage debt outstanding in Q4 2023 was down from that in Q3. This is very different from the usual annual pattern where growth in multifamily mortgage debt outstanding is higher in Q4 than in other quarters of the year. Q4 growth in multifamily mortgage holdings was less than half of the Q4 2022 level.
The MBA reported that multifamily mortgage debt outstanding rose by $24.97 billion in Q4, well below the $36.70 billion increase in Q3. Total multifamily mortgage debt reached a level of $2.086 trillion. Compared to the year-earlier level, multifamily mortgage debt was up $105.5 billion (5.3 percent).
The total of all commercial mortgage debt, including multifamily debt, outstanding at the end of Q4 rose 0.9 percent from its Q3 2023 level to $4.695 trillion. Multifamily mortgage debt represented 44.4 percent of commercial mortgage debt outstanding.
Earlier, the MBA had reported that multifamily mortgage originations had risen 13 percent in Q4. However, the Q4 2023 multifamily mortgage originations index was reported to be down 27 percent from its level in Q4 2022.
Sizing the growth
The shares of multifamily mortgage debt held by various classes of lenders are shown in the first chart, below.
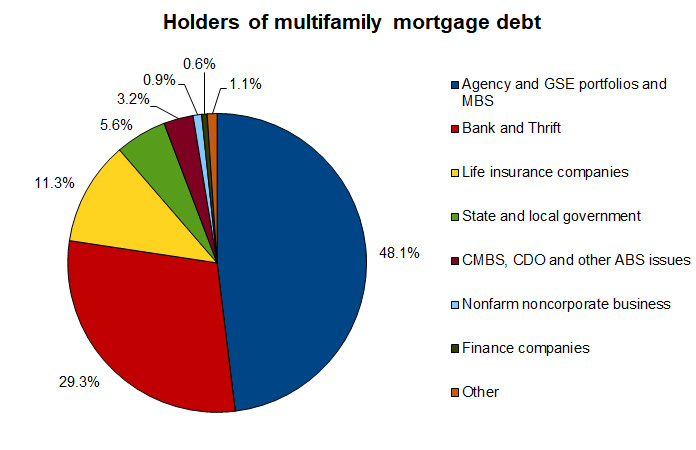
Of the increase in multifamily mortgage debt outstanding in the quarter, $15.5 billion, or 62.1 percent, was held by “Agency and GSE portfolios and MBS”. These are agencies, like the Federal Housing Administration and Government Sponsored Enterprises (GSEs) like Fannie Mae and Freddie Mac, who buy up mortgages and sell some of the debt as Mortgage-Backed Securities (MBS). At the end of Q4, the GSEs holdings of multifamily mortgage debt remained at 48.1 percent of the total outstanding. This is the same level as in the Q3 report but it is up 0.2 percentage points from the revised share for Q3 listed in this quarter’s report.
Banks and Thrifts, the second largest holders of multifamily mortgages, increased their multifamily mortgage holdings by $5.3 billion. The Q4 figure represented 21.2 percent of the increase in multifamily mortgage debt outstanding, well below their holdings of 29.3 percent of total multifamily mortgage debt outstanding.
Life Insurance companies increased their direct holding of multifamily mortgage debt by $5.17 billion in the quarter, 20.7 percent of the total net increase. This raised their holdings to $235.0 billion. Their share of total multifamily mortgage debt outstanding rose 0.1 percentage point from the revised level of the quarter before to 11.3 percent in the quarter. However, this figure does not account for the multifamily mortgages these companies hold through commercial mortgage-backed securities (CMBS).
State and local governments held 5.6 percent of outstanding multifamily mortgage debt at the end of Q4. They increased their holdings by $901 million to a total of $115.9 billion at the end of the quarter.
CMBS, CDO (collateralized debt obligations) and other ABS (asset backed securities) issuers increased their holdings of multifamily mortgage debt in Q4 by $66.7 million. Their share of multifamily mortgage debt outstanding fell 0.1 percentage points to 3.2 percent.
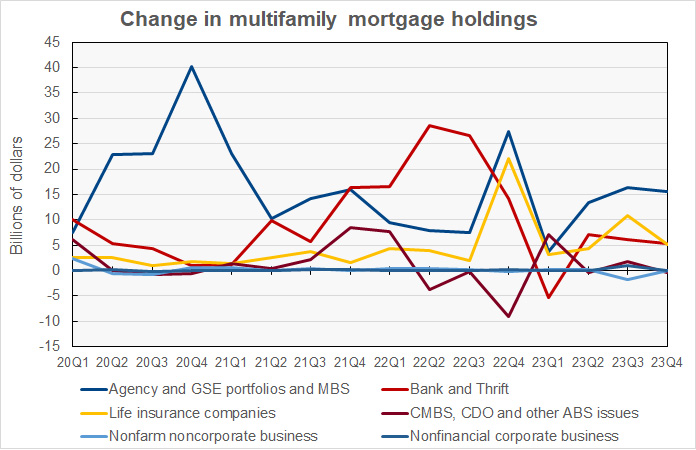
The next chart, below, shows the quarterly changes in multifamily mortgage holdings of the 6 largest classes of lenders since Q1 2020. After wild swings in the levels of changes in mortgage holdings quarter-by-quarter since 2020, the quarterly growth rates in mortgage holdings have become relatively stable over the last 3 quarters. The chart highlights the importance of the GSEs to the growth in outstanding mortgage volume. It also shows that banks remain important to growth in multifamily mortgages outstanding but that life insurance companies have accounted for more growth in mortgages outstanding than did banks for 3 of the last 5 quarters.
Who’s growing?
The next chart, below, plots the current share of multifamily mortgage debt outstanding for a given class of lender alongside that class of lender’s share of net new mortgage debt outstanding in Q4. When the latter share is greater than the former, that class of lender is increasing its share of the multifamily mortgage market.
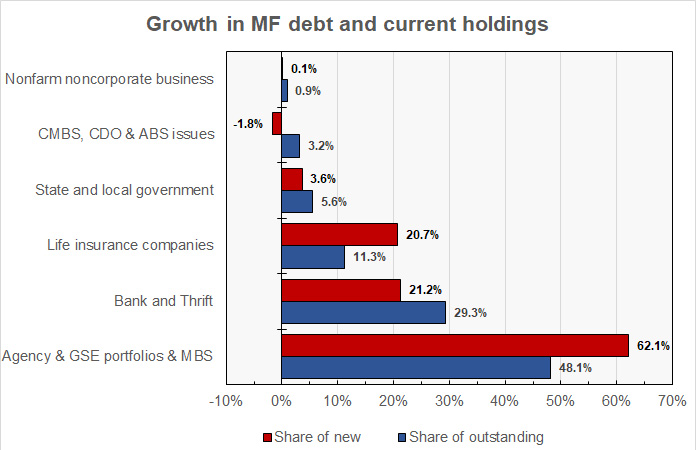
The chart shows that the GSEs again provided the majority of the increase in multifamily mortgage lending during the quarter. Banks were the second leading contributor to the mortgage debt increase. However, banks’ share was well below their historic average and was only fractionally above the share of life insurance companies. Life insurance companies grew their holdings at nearly twice their share of multifamily mortgage debt outstanding. The shares of the growth in multifamily mortgage debt outstanding of the other lender types in the top 6 were less than their shares of existing mortgage debt. Therefore these lenders became relatively less important as sources of funds.
The report does not cover loans for acquisition, development or construction, or loans collateralized by owner-occupied commercial properties. The full report also includes information on mortgage debt outstanding for other commercial property types. The full report can be found here.


