

The latest rent report from Apartment List shows that the national median monthly rent growth in March was +0.6 percent, the second consecutive gain after several months of declines. Year-over-year rent growth was -0.8 percent. This was slightly smaller than last month’s year-over-year decline, but it marks 10 consecutive months of declines.
Apartment List reported the national median apartment rent to be $1,388, up $8 from last month’s revised figure.
Charting the data
The first chart shows the history of the national median rent level since 2017. It is plotted year-by-year so that the annual change pattern is visible.
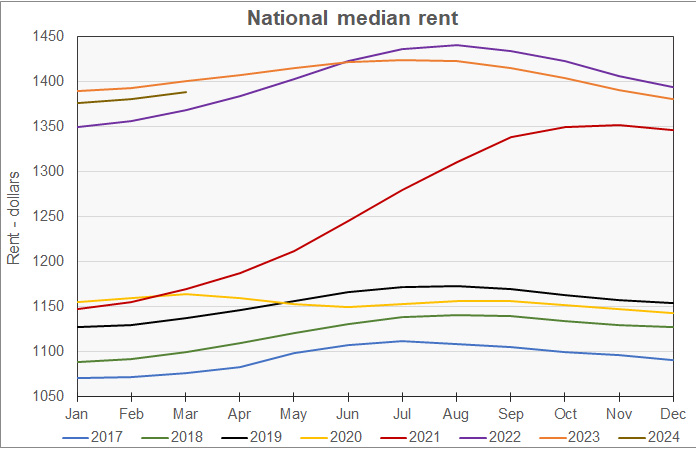
The chart shows that rents 2024 are tracking below those in 2023 but are higher than those in any previous year. However, they are following the usual seasonal pattern of rents beginning to rise early in the year.
The next chart shows the year-over-year rate of rent growth since January 2018 plotted along with the national median apartment vacancy rate.
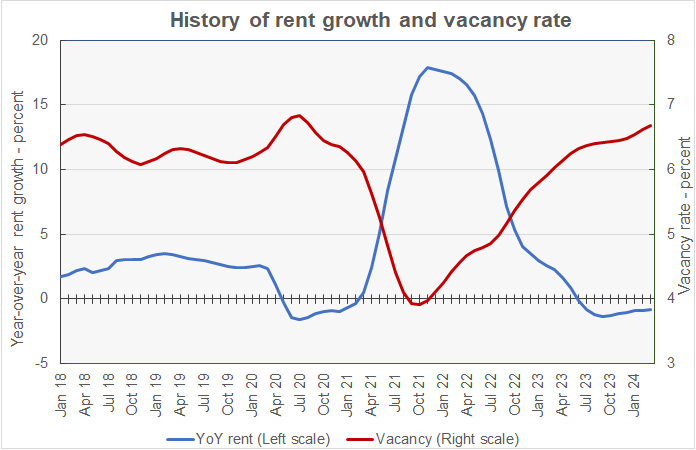
The chart shows that the national average vacancy rate of 6.7 percent is up slightly from last month’s rate. It is also higher than the vacancy rates in March for the pre-pandemic years of 2017 through 2019. However, it is slightly below the peak vacancy rate reached in the pandemic summer of 2020.
The seasonal variation in vacancy rates saw national average vacancies peak in April of each of the pre-pandemic years in the Apartment List dataset. If this pattern holds this year, vacancies will rise again next month before falling in the summer season. However, record completions arriving this year may disrupt that pattern.
The chart also shows that year-over-year rent growth has now been negative for 10 months straight. While the year-over-year decline is down slightly from its recent peak rate in September 2023, it is only slowly approaching positive territory.
The final chart shows the change in the national median apartment rent since January 2017 in nominal dollar terms along with two other measures of rent accounting for changes in income and price levels. The Income adjusted curve adjusts the rent by the change in average hourly earnings as reported by the Bureau of Labor Statistics. The Inflation adjusted curve adjusts the rent by the general change in price level as measured by the not-seasonally-adjusted Consumer Price Index for all urban consumers (CPI-U).
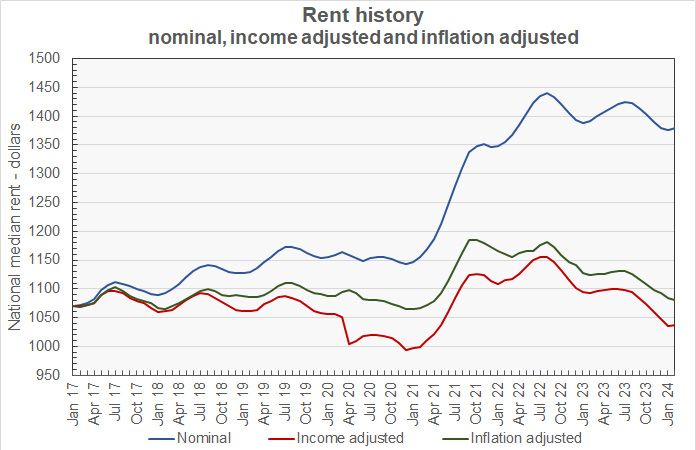
The curves show that, while rents have soared in nominal terms, when adjusted for wage growth or for the general increases in prices, they are below their pre-pandemic levels. However, the income-adjusted rent levels should viewed with caution as described below.
A comment about the wage-growth data: changes to this data are based on the average wages of people who are working, not changes to the wages of any individual worker. Therefore, the results can be influenced by the wages of a given class of worker rising or by a change in the composition of the workforce. For example, during the pandemic-induced shutdowns, more highly paid professionals were able to work from home while lower-paid manual laborers were often furloughed. The elimination of low-wage workers from the workforce resulted in a jump in the average wage level without anyone necessarily receiving a raise. Accordingly, the sharp decline in the income-adjusted rent levels in 2020 and 2021 should be viewed as an anomaly caused by widespread disruptions to the labor force rather than a true improvement in apartment affordability.
Ranking the metros
Apartment List provides the underlying data they collected in compiling their report and that data was used to create the tables, below. The tables look at the 50 most populous metropolitan statistical areas defined by the US Census Bureau and identify the top and bottom 10 metros for year-over-year rent growth. The tables provide the median monthly rent in the metro, the metro’s vacancy rate, the annual percentage change in rent (YoY Metro) along with the percentage change from the prior month’s rent level (MoM Metro). They also list the percentage changes in rent for the metro areas compared to the rent levels in February 2020, right before the pandemic struck (Feb 20).
The first table shows the 10 metros with the largest annual percentage rent increases. The list is notable for the absence of fast-growing sunbelt cities.
| Metro | Metro Rent | Vacancy rate | YoY Metro | MoM Metro | Feb 20 |
| Grand Rapids | $1,221 | 7.9 | 5.6 | 1.66 | 30.7 |
| Louisville | $1,192 | 5.7 | 4.6 | 1.94 | 23.3 |
| Providence | $1,413 | 5.0 | 4.5 | 1.90 | 31.9 |
| Hartford | $1,498 | 5.0 | 4.2 | 1.15 | 28.5 |
| Virginia Beach | $1,527 | 5.6 | 3.9 | 0.74 | 29.3 |
| Milwaukee | $1,195 | 5.9 | 3.2 | (0.06) | 22.7 |
| Washington | $2,116 | 5.2 | 3.2 | 1.11 | 13.8 |
| Chicago | $1,571 | 5.4 | 2.6 | 0.92 | 18.2 |
| Pittsburgh | $1,155 | 6.5 | 2.6 | 0.96 | 14.6 |
| Boston | $2,137 | 5.6 | 2.2 | 1.22 | 16.7 |
The next table shows the 10 metros with the smallest annual rent increases.
| Metro | Metro Rent | Vacancy rate | YoY Metro | MoM Metro | Feb 20 |
| Austin | $1,446 | 9.6 | (7.0) | (0.34) | 14.3 |
| Atlanta | $1,481 | 7.4 | (4.2) | 0.70 | 19.5 |
| San Antonio | $1,244 | 8.4 | (3.7) | 0.19 | 15.5 |
| Raleigh | $1,442 | 8.1 | (3.7) | 0.53 | 23.6 |
| Jacksonville | $1,385 | 6.8 | (3.7) | 0.57 | 25.6 |
| Orlando | $1,570 | 6.7 | (3.6) | 0.58 | 25.0 |
| Nashville | $1,401 | 7.9 | (3.5) | 0.57 | 20.4 |
| Portland | $1,646 | 6.3 | (3.2) | 0.91 | 12.0 |
| Phoenix | $1,444 | 7.1 | (3.2) | 0.40 | 24.9 |
| Charlotte | $1,361 | 8.1 | (2.9) | 0.23 | 21.6 |
In March, 27 of the 50 most populous metros saw their rents rise on a year-over-year basis, matching last month’s count. In addition, 46 metros saw rents rise on a month-over-month basis, up from 39 last month. San Francisco is again the only metro of the top-50 that has rents that are below their level in February 2020, immediately before the pandemic.
The complete Apartment List report covers many more metros and also provides city, county and state data. It gives readers with the opportunity to download their data sets. The latest report can be found here.


