

The Census Bureau released its quarterly report on home ownership and occupancy for Q1 2024. It stated that the rental housing vacancy rate was 6.6 percent, unchanged from its level in the last two quarterly reports.
Looking at vacancies
The headline vacancy rate reported by Census is for all rental housing in the country, both single-family and multifamily. Census breaks down this figure in various ways, including by the number of units in the building. The chart, below, illustrates this comparison.
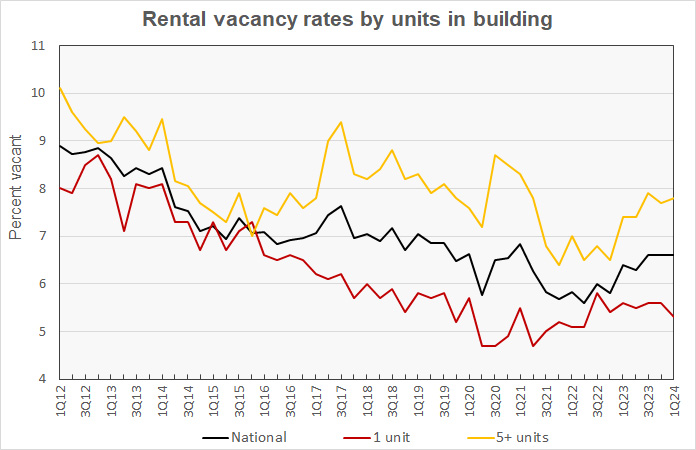
The chart shows that the vacancy rate for multifamily housing with 5 or more units per property as measured by the Census Bureau ticked back up to 7.8 percent in Q1. The single-family rental vacancy rate fell 0.3 percentage points to 5.3 percent.
Note that Apartment List reported that the multifamily rental vacancy rate at the end of March was 6.7 percent. By contrast, Yardi Matrix reported the multifamily rental vacancy rate in March as 5.5 percent. While the Census Bureau attempts to capture all rental housing in the country, other data sources may focus on subsets of the market like professionally managed properties and so they come up with different results.
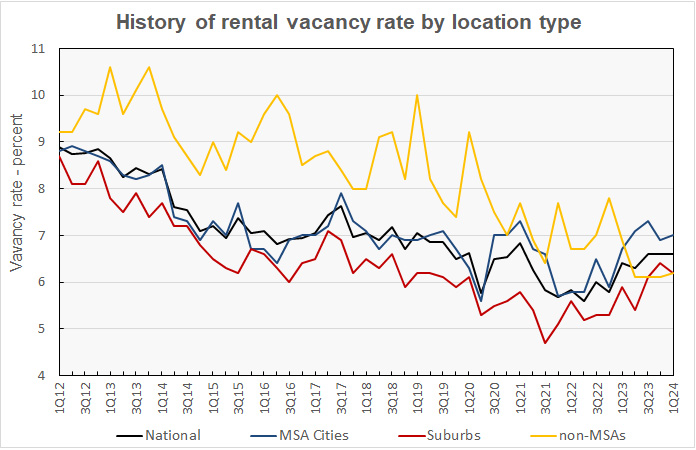
The Census Bureau reported that the rental vacancy rate in the core cities of the Census Bureau’s Metropolitan Statistical Areas (MSAs) was 7.0 percent in Q1 2024, up from 6.9 percent reported for the previous quarter. The rental vacancy rate in the suburbs of the MSAs was 6.2 percent in Q1 2024, down 0.2 percentage points for the quarter. These trends are shown in the next chart, below.
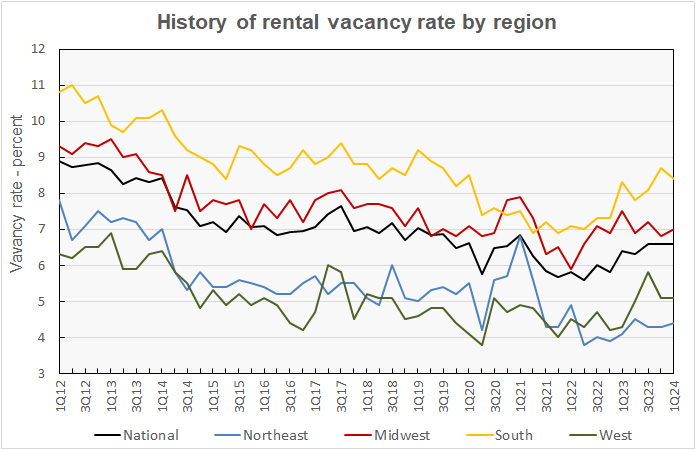
The rental vacancy rate history for each of the Census regions is shown in the next chart, below. Vacancy rates were reported lower in the South and unchanged in the West but higher in the Midwest and Northeast. By the numbers, the vacancy rates were reported to be 4.4 percent in the Northeast, 7.0 percent in the Midwest, 8.4 percent in the South and 5.1 percent in the West.
Census reported that 62.1 percent of vacant rental units were in structures with 2 or more units. Only about 15.6 percent of the vacant multifamily units had 3 or more bedrooms, with 1 bedroom units comprising 41.6 percent and 2 bedroom units comprising 39.3 percent of vacant stock. The median unit vacancy duration for multifamily properties in Q1 2024 was 2.7 months, up from 2.3 months one year earlier.
Rentership rate edges higher
The Census Bureau reported that 34.4 percent of the country’s 131,206,000 occupied housing units were inhabited by renter households in Q1 2024. This rate is up from that in Q4 as the number of renter households grew slightly while the number of homeowning households declined during the quarter.
The history of the number of occupied housing units and the share of renter households since 2012 is shown in the next chart, below. The chart shows that the reported number of renter households has been stuck in the range of 41 to 45 million since 2014. However, the reading for Q1 2024 rose by 55,000 to 45,040,000 households. This set a new all-time high for the fourth quarter in a row and is the first time that the number of renter households has exceeded 45 million.
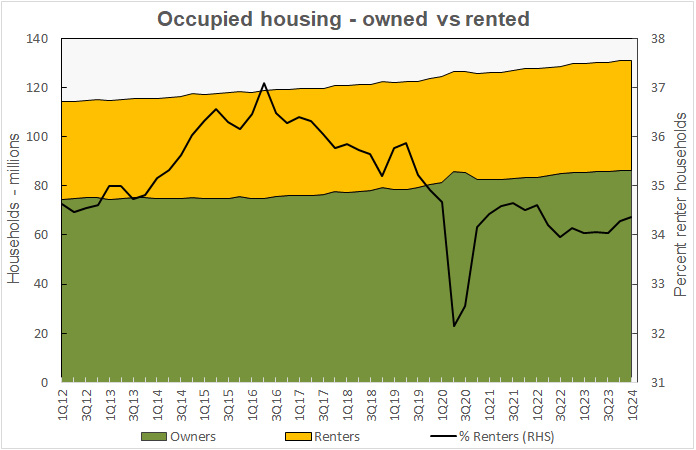
The number of homeowning households dropped by 168,000 in the quarter to 86,052,000 households. This is the first decline in the number of homeowning households since 2020, when pandemic-related disruptions made the data suspect.
Census reports positive, but falling, rent growth
The Census Bureau also tracks the median asking rents for the country as-a-whole. The history of their findings along with the year-over-year rent growth rate is shown in the next chart, below.
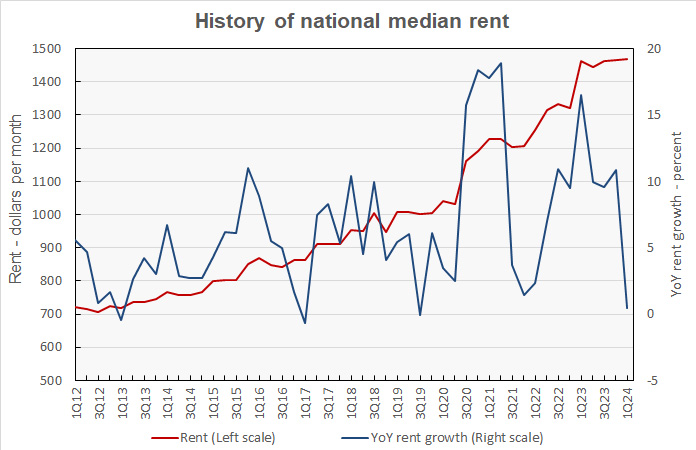
Census reported that monthly rents rose $4 in Q1 2024 to a new all-time high. Census reported the national median rent to be $1,469 per month, a gain of 0.3 percent from the prior quarter and 0.5 percent from its level in Q1 2023.
By contrast, Yardi Matrix reported that the national average apartment rent in March was $1,721 per month. Apartment List reported the national average apartment rent in March as $1,388 per month.
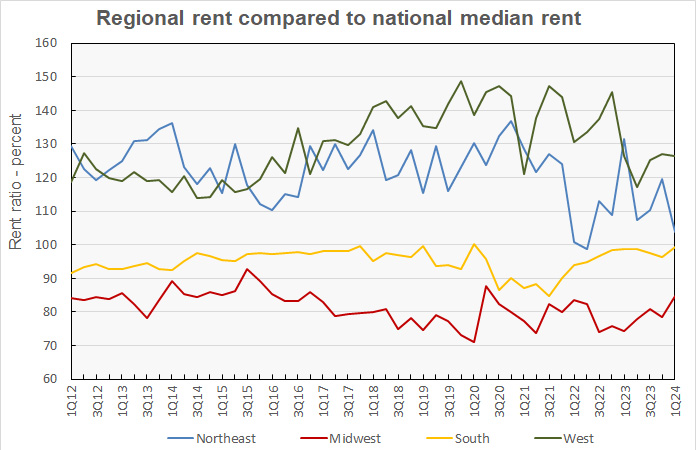
The last chart, below, shows the history of the median rent by Census region as a percentage of the national median rent. Rents were 3.7 percent higher than the national median in the Northeast, and 26.3 percent higher in the West. Rents were reported 15.3 percent lower than the national median in the Midwest and 0.5 percent lower in the South.
The Census report is called Quarterly Residential Vacancies and Homeownership, First Quarter 2024. It is available here.


