

The producer price index (PPI) report from the Bureau of Labor Statistics (BLS) stated that construction materials prices were up 0.3 percent month-over-month in April on a seasonally adjusted basis. In addition, the change in construction materials prices for March was revised from a 0.1 percent decline to a 0.1 percent increase. The index of components and materials for construction was up 1.7 percent from its year-earlier level.
Overall prices for processed goods for intermediate demand were up 0.6 percent for the month. The volatile prices of processed fuels and lubricants rose 1.6 percent. The overall processed goods for intermediate demand index was 0.5 percent lower than its year-earlier level.
For reference, the changes in these indices compare with a 3.4 percent rise in the all-items consumer price index (CPI-U) for the 12 months ending in April. The seasonally adjusted April CPI-U was up 0.3 percent from March’s level. Energy prices were up 1.1 percent for the month and up 2.3 percent year-over-year. The shelter portion of the CPI-U was up 0.4 percent for the month and was 5.5 percent higher than its year-ago level. Seasonally adjusted rent of primary residence was up 0.4 percent for the month and 5.4 percent for the year.
Yield Pro compiled the BLS reported changes for our standard list of construction materials prices. These are prices of materials which directly impact the cost of constructing an apartment building. The first two right hand columns of the table provide the percent change in the price of the commodity from a year earlier (12 Mo PC Change) and the percent change in price from March (1 Mo PC Change). If no price data is available for a given commodity, the change is listed as N/A.
The pre-COVID column lists the change in the current construction materials prices relative to the average of prices from December 2019 through February 2020, before the pandemic impacted the economy. This provides a longer-term view of construction materials price trends.
| Commodity | 12 Mo PC Change | 1 Mo PC Change | Pre-covid Change |
| Softwood lumber | (4.3) | 1.4 | 16.2 |
| Hardwood lumber | 1.4 | 1.8 | 29.2 |
| General millworks | 1.3 | 0.4 | 31.3 |
| Soft plywood products | 0.9 | 0.4 | 72.1 |
| Hot rolled steel bars, plates and structural shapes | (4.4) | (1.5) | 52.7 |
| Copper wire and cable | 2.8 | 5.1 | 39.0 |
| Power wire and cable | 11.4 | 0.6 | 123.5 |
| Builder’s hardware | (0.9) | 0.0 | 24.4 |
| Plumbing fixtures and fittings | 1.4 | 0.0 | 19.3 |
| Enameled iron and metal sanitary ware | N/A | N/A | N/A |
| Furnaces and heaters | 2.6 | 0.0 | 38.8 |
| Sheet metal products | 1.7 | (0.0) | 48.1 |
| Electrical Lighting fixtures | (0.4) | (0.0) | 17.7 |
| Nails | (12.1) | (0.0) | 22.9 |
| Major appliances | 1.1 | (0.2) | 22.1 |
| Flat glass | N/A | N/A | N/A |
| Ready mix concrete | 8.0 | 0.1 | 37.4 |
| Asphalt roofing and siding | 2.3 | (2.1) | 38.7 |
| Gypsum products | 0.8 | (0.6) | 45.1 |
| Mineral wool insulation | 1.5 | (0.3) | 44.5 |
The prices used by the BLS in compiling the indexes are collected on the Tuesday of the week containing the 13th day of the month. In April that would have been April 12. In the May report, the data collection date will be May 14.
The first chart, below, shows the price index history for wood products over the past 37 months.
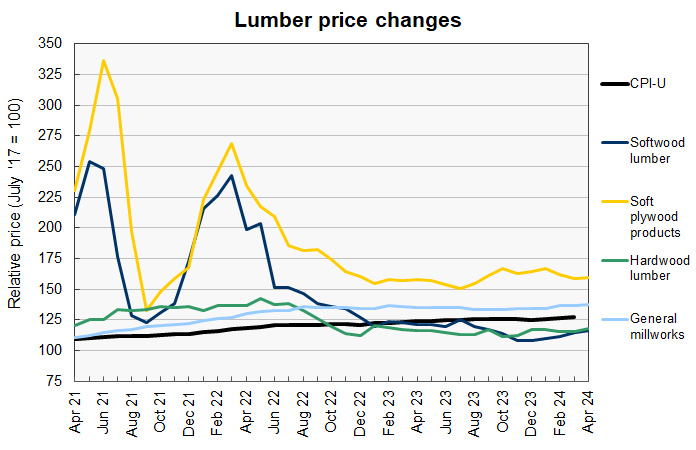
The softwood lumber price index was reported to rise by 1.4 percent in April. Softwood lumber prices are still down 4.3 percent year-over-year, but they have risen 7.7 percent since their recent low last November.
The hardwood lumber price index was reported to rise 1.8 percent in April. However, the price index for March was revised lower by 2.8 percent so the reported hardwood lumber price index is 1.0 percent lower than the preliminary level reported last month.
The soft plywood price index was reported to rise 0.4 percent in April. However, the price index for March was revised lower by 2.0 percent so the reported soft plywood price index is 1.6 percent lower than the preliminary level reported last month.
The next chart, below, shows the recent history of several other construction materials prices. These are relatively simple commodities whose prices are strongly driven by those of the materials of which they are comprised.
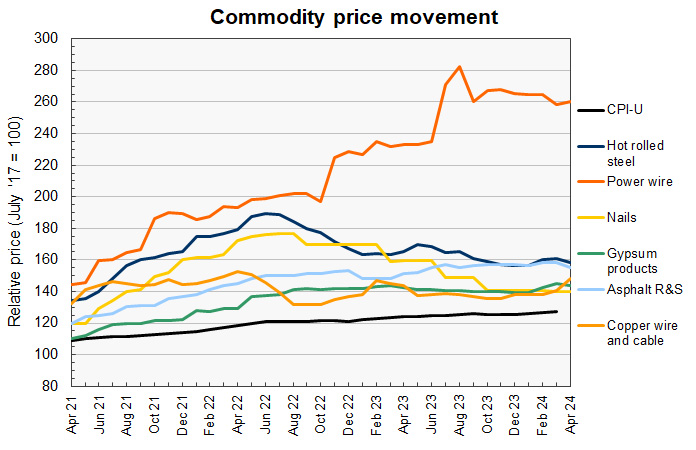
The price index for copper wire and cable was reported to be 5.1 percent higher for the month. This is on top of a 0.2 percent upward revision for the price index for the previous month. This was by far the largest monthly jump for any of the construction materials prices that we track. The price for copper wire and cable is now up 2.8 percent year-over-year.
The price index for power wire and cable was reported to rise 0.6 percent in April. It remains 11.4 percent higher than its year-earlier price.
The price index for hot rolled steel bars was reported to fall by 1.5 percent on top of a 0.7 percent downward revision to the price index for the month before.
Price changes for several of the more finished goods from our sample are illustrated in the final chart, below. There are some unusual trends in this data.
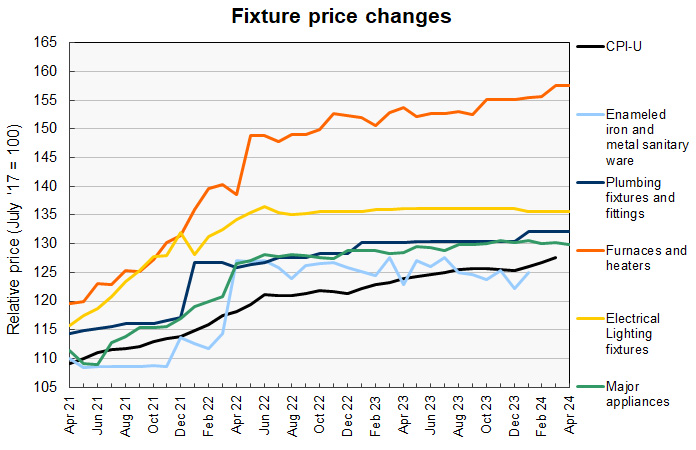
For the third consecutive month, no price index was reported for enameled iron and metal sanitary ware. No price index was reported for flat glass for April either, but this month’s report did list price indexes for flat glass for February and March, which had not previously been reported.
For 4 months in a row, the exact same price index has been reported for plumbing fixtures and fittings. For 8 months in a row prior to that streak, that price index was also reported with the exact same value. The earlier value was 1.3 percent lower than the current one. It seems unlikely that a price index would not vary for months at a time but the BLS provided no explanation for this trend.
The price index for furnaces and heaters was reported to be unchanged from that for March, but the March index was revised lower by 2.9 percent in this month’s report.
The price index for electrical lighting fixtures, which had been rising rapidly, has been remarkably stable since the middle of 2022.
The full current BLS report can be found here.


