

The producer price index (PPI) report from the Bureau of Labor Statistics (BLS) stated that construction materials prices were down 0.1 percent month-over-month in March on a seasonally adjusted basis. The index of components and materials for construction was up 1.4 percent from its year-earlier level, down from the 1.8 percent year-over-year rise reported last month.
Overall prices for processed goods for intermediate demand were down 0.5 percent for the month. The volatile prices of processed fuels and lubricants reversed again this month with prices falling 1.5 percent after rising 6.2 percent last month. The overall processed goods for intermediate demand index was 1.7 percent lower than its year-earlier level.
For reference, the changes in these indices compare with a 3.5 percent rise in the all-items consumer price index (CPI-U) for the 12 months ending in March. The seasonally adjusted March CPI-U was up 0.4 percent from February’s level. Energy prices were up 1.1 percent for the month and up 2.1 percent year-over-year. The shelter portion of the CPI-U was up 0.4 percent for the month and was 5.7 percent higher than its year-ago level. Seasonally adjusted rent of primary residence was also up 0.4 percent for the month and 5.7 percent for the year.
Yield Pro compiled the BLS reported changes for our standard list of construction materials prices. These are prices of materials which directly impact the cost of constructing an apartment building. The first two right hand columns of the table provide the percent change in the price of the commodity from a year earlier (12 Mo PC Change) and the percent change in price from February (1 Mo PC Change). If no price data is available for a given commodity, the change is listed as N/A.
The pre-COVID column lists the change in the current construction materials prices relative to the average of prices from December 2019 through February 2020, before the pandemic impacted the economy. This provides a longer-term view of construction materials price trends.
| Commodity | 12 Mo PC Change | 1 Mo PC Change | Pre-covid Change |
| Softwood lumber | (6.8) | 3.2 | 14.6 |
| Hardwood lumber | 1.7 | 0.6 | 30.5 |
| General millworks | 0.8 | (0.0) | 31.2 |
| Soft plywood products | 3.1 | 0.1 | 75.0 |
| Hot rolled steel bars, plates and structural shapes | (0.9) | 0.9 | 56.1 |
| Copper wire and cable | (3.0) | 1.6 | 32.1 |
| Power wire and cable | 11.4 | (2.3) | 122.0 |
| Builder’s hardware | 1.0 | 0.0 | 26.7 |
| Plumbing fixtures and fittings | 1.4 | 0.0 | 19.3 |
| Enameled iron and metal sanitary ware | N/A | N/A | N/A |
| Furnaces and heaters | 6.2 | 3.2 | 43.0 |
| Sheet metal products | 2.4 | 0.5 | 47.9 |
| Electrical Lighting fixtures | (0.2) | 0.0 | 17.7 |
| Nails | (12.3) | (0.4) | 22.6 |
| Major appliances | 0.7 | 0.2 | 21.5 |
| Flat glass | N/A | N/A | N/A |
| Ready mix concrete | 7.0 | 0.1 | 35.2 |
| Asphalt roofing and siding | 7.0 | 0.1 | 41.7 |
| Gypsum products | 1.1 | 1.9 | 46.9 |
| Mineral wool insulation | 2.3 | 0.4 | 45.1 |
| CPI-U unadjusted | 3.5 | 0.6 | 20.9 |
The first chart, below, shows the price index history for wood products over the past 37 months. Note that the prices used by the BLS in compiling the indexes are collected on the Tuesday of the week containing the 13th day of the month. In March that would have been March 12. In the April report, the data collection date will be April 9.
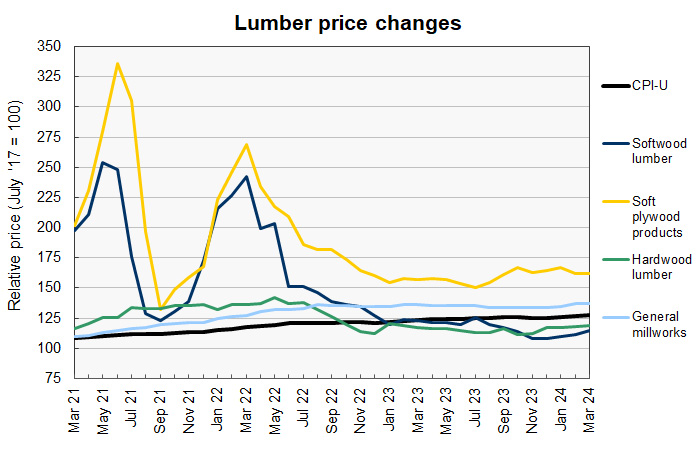
The softwood lumber price index was reported to rise by 3.2 percent in March aided by a 0.2 percent downward revision to February’s price index. Softwood lumber prices are still down year-over-year but have risen 6.2 percent since November.
The soft plywood price index was reported to rise only slightly in March. However, the price index for February was revised lower by 2.6 percent so the reported soft plywood price index is 2.4 percent lower than the preliminary level reported last month.
Looking ahead, Business Insider reported that the market price of lumber closed on March 12 at $575 but fell to $556 on April 9. Softwood lumber prices have generally been trending higher since last October but they are down from their recent peak of $609 in late March. Lumber prices in the futures markets have also been moderating since our last report. The July 2024 contract closed at $579 on April 9, down from $623 on March 12. The September 2024 contract closed at $594 on April 9.
The next chart, below, shows the recent history of several other construction materials prices. These are relatively simple commodities whose prices are strongly driven by those of the materials of which they are comprised.
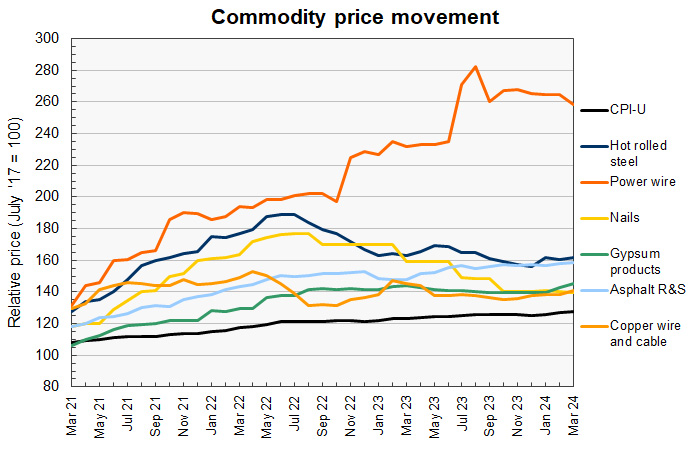
The price index for power wire and cable was reported to fall 2.3 percent in March but the price indexes for the three prior months were all revised higher by about 1 percent. The power wire price index was again 11.4 percent higher year-over-year.
The price index for copper wire and cable was reported to be 1.6 percent higher for the month helped by a 0.5 percent downward revision to last month’s index.
The price index for hot rolled steel bars was reported to rise by 0.9 percent and this was on top of a 4.7 percent upward revision to the price index for the month before. The 5.6 percent jump from the preliminary price level reported for last month was by far the highest of any of the commodities we track.
Looking ahead at prices for underlying materials, MarketWatch reported that the NYSE American steel index moved higher for the month. It closed at $2,096 on March 12 and closed at $2,201 on April 9. However, steel futures were lower. The July 2024 contract closed 3.7 percent lower on April 9 than it did on March 12 while the September 2024 contract closed 3.1 percent lower.
The price of copper closed at $4.30 per pound on April 9, up $0.37 since March 12. Its April 9 closing price was the high for the period since March 12. Its March 12 closing price was the low for the period.
The price of aluminum has been moving higher since late March. It closed on April 9 at $2,460, up $211 from its level on March 12. The April 9 price was the high for the period since March 12. The low for the period was $2,251 on March 14.
Price changes for several of the more finished goods from our sample are illustrated in the final chart, below.
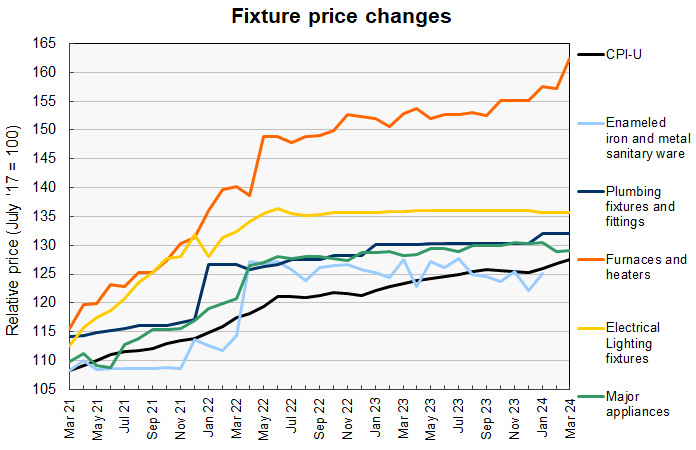
The construction materials prices for the commodities shown in this chart have been relatively stable for more than a year. The exception to this rule is the price index for furnaces and heaters which rose 3.2 percent for the month and is up 6.5 percent since September.
Again this month, no price index was reported for enameled iron and metal sanitary ware or for flat glass.
The full current BLS report can be found here.


