

The Federal Reserve Board (Fed) recently released the results of its 2023 survey of the financial well-being of U.S. households. The report contains insights on how renter households were faring in late 2023.
Survey background
The survey conducted by the Fed is called the Survey of Household Economics and Decision-making (SHED). The 2023 survey was the 11th annual survey in the series. It gathered information from 11,400 participants, of whom 2896 (25.4 percent) were renters. The survey was conducted from October 20 through November 5, 2023.
Note that the Census Bureau reported that renters comprised 34 percent of households in Q1 2024.
Survey participants were asked a variety of questions about their personal situations. Among these were whether they owned, rented, or neither owned nor paid rent. The first chart, below, shows the portions of renters and those who neither own nor paid rent by the age of the participant.
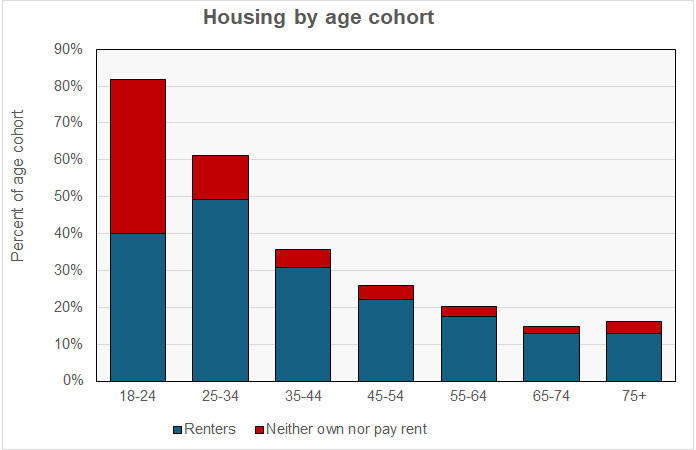
In the 18 to 24 age range, the share of survey participants who neither own nor paid rent exceeds the share of renters 41.8 percent to 40.0 percent. For participants in the 25 to 34 age range, renters take the lead 49.4 percent to 11.7 percent. The share of homeowners rises from 18.2 percent to 38.9 percent between these age cohorts.
The highest homeownership rate is for the 65 to 74 year-olds at 85.2 percent. Renters comprise just 13 percent of that group.
The next chart shows the breakdown in the share of total respondents by income level for those who are renters and for those who neither own nor paid rent.
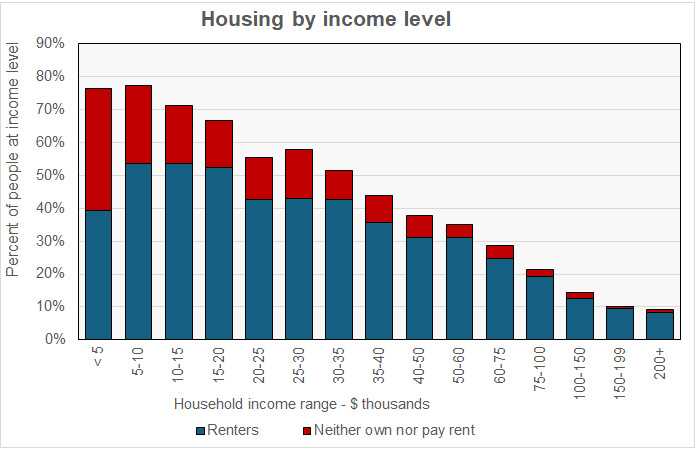
The results show that very low-income people are unlikely to own a home and generally rent or live freely. The share of renters within any income group falls as income rises. However, even at incomes above $200,000, 8.4 percent of respondents were renters.
Among renters, 36 percent said that they prefer to rent rather than own. Among the advantages cited for renting were convenience and flexibility (57 percent), less financial risk (44 percent) and less cost (42 percent). However, 65 percent of renters said that they could not afford a down payment and 48 percent said that they could not afford a mortgage payment. Among renters, 30 percent said that they were trying to buy a home.
How are you doing?
The basic question of the survey was what is the respondent’s overall financial well-being. Survey participants were asked to select one of four possible answers. They were: finding it difficult to get by, just getting by, doing okay, and living comfortably. The first chart below compares the responses of renters to those of all survey respondents together.
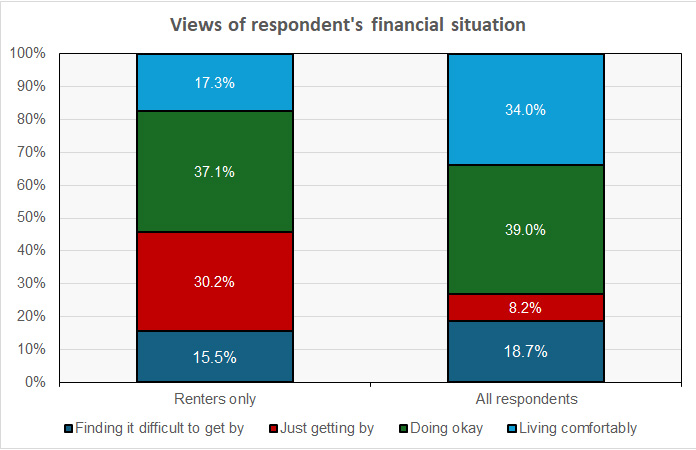
Somewhat surprisingly, the chart shows that renters were slightly less likely than all survey participants to say that they were finding it difficult to get by. On the other hand, renters were only half as likely to say that they were living comfortably.
Another foundational question was whether the participant’s financial well-being was better than it was 12 months earlier. The responses to this question are illustrated in the next graph.
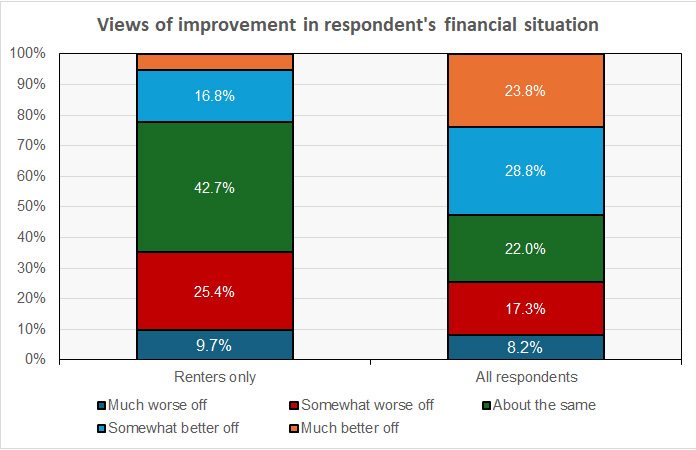
The total of the “worse off” answers, much or somewhat, for renters is almost 10 percentage points higher than that for all participants, 35.1 percent to 25.5 percent. Also the share of renters who thought that they were much better off than they were 12 months earlier is less than ¼ of the share of all participants.
Other topics
The survey covers many other topics in addition to housing. These include questions on employment, income and expenses, education, and retirement and investments.
The full report by the Board of Governors of the Federal Reserve System is called Economic Well-Being of U.S. Households in 2023 (Washington: Board of Governors, 2024).


