

The Census Bureau released its quarterly report on home ownership and occupancy for Q4 2022. It stated that the rental housing vacancy rate was 6.4 percent, up from a level of 5.8 percent in Q4 2022 and up from a reported level of 5.8 percent in Q1 2022.
Multiple looks at vacancy data
The headline vacancy rate reported by Census is for all rental housing in the country, both single-family and multifamily. Census breaks down this figure in various ways, including by the number of units in the building. The chart, below, illustrates this comparison.
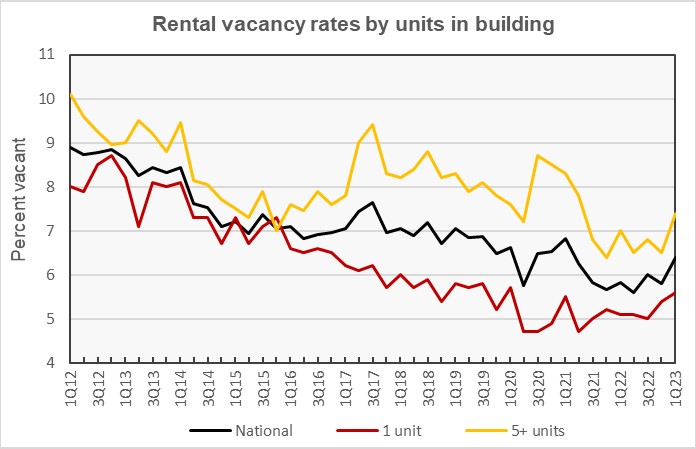
The chart shows that vacancy rates for both single-family and multifamily rentals have risen recently, although single-family vacancy rates remain well below those of multifamily rentals.
By the numbers, the single-family rental vacancy rate was reported to be 5.6 percent in Q1 2023, up 0.2 percentage points from last quarter and up 0.5 percentage points from the level in Q1 2022. The rental vacancy rate for units in buildings with 5 or more units was 7.4 percent in Q1 2023, up from 6.5 percent in Q4 2022 and up from 7.0 percent in Q1 2022.
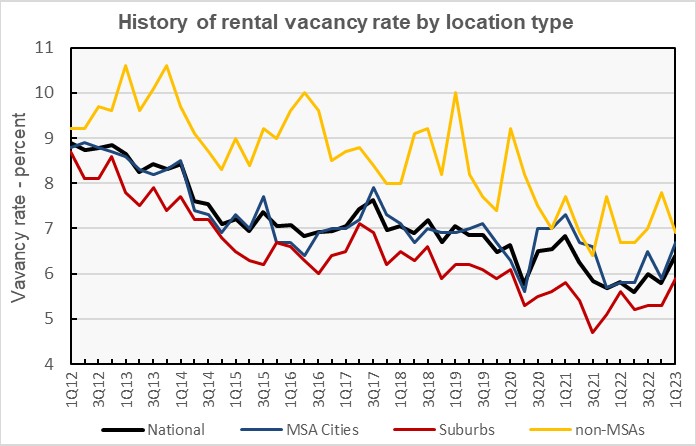
The rental vacancy rate in the core cities of the Census Bureau’s Metropolitan Statistical Areas (MSAs) was 6.7 percent in Q1 2023, up from 5.9 reported for the previous quarter. The rental vacancy rate in the suburbs of the MSAs was 5.9 percent in Q1 2023, up 0.6 percentage points from its level in Q4. These trends are shown in the next chart, below.
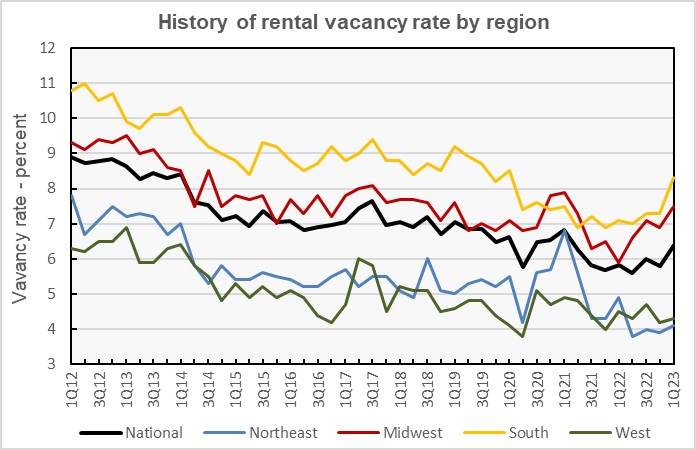
The rental vacancy rate history for each of the Census regions is shown in the next chart, below. The long-term trend has been for vacancy rates to fall in all regions since 2012. However, recently vacancy rates have risen in the Midwest and the South regions while remaining historically low in the West and Northeast regions.
Census reported that 67 percent of vacant rental units were in structures with 2 or more units. Only about 16 percent of the vacant multifamily units had 3 or more bedrooms, with 1-bedroom units comprising 42 percent and 2-bedroom units comprising 39 percent of vacant stock. The figures on vacancies by bedroom count are unchanged from last quarter. The median unit vacancy duration for multifamily properties in Q1 2023 was 2.5 months, up from 2.7 months one year earlier.
Tracking rentership
The Census Bureau reported that 34.0 percent of the country’s 129,234,000 occupied housing units were inhabited by renter households in Q1 2023. This rate is down slightly from that in Q4 as the number of homeowning households managed a slight increase during the quarter while the number of rental households fell.
The history of the number of occupied housing units and the share of renter households since 2012 is shown in the next chart, below. The chart shows that the reported number of renter households has been stuck in the range of 41 to 44 million since 2014. However, the reported number of homeowning households has increased by 10 million to a level of 85 million since 2014.
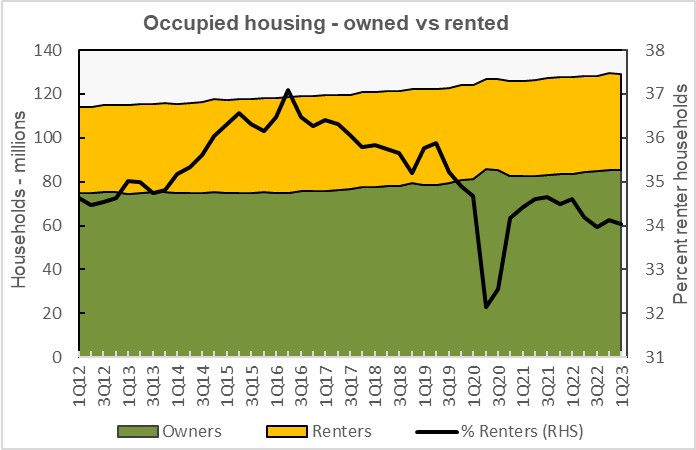
The number of renter-occupied housing units were reported to fall by 178,000 in Q1 to 44.0 million. By contrast, the number of owner-occupied housing units was reported to rise by 16,000 to 85.2 million.
Rents rebound
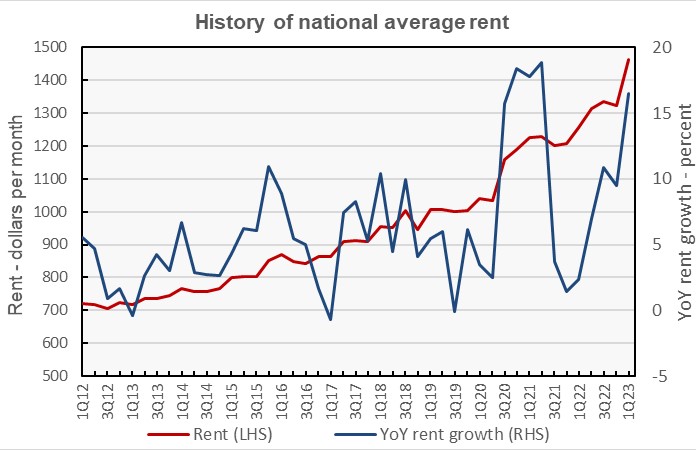
The Census Bureau also tracks the median asking rents for the country as-a-whole. The history of their findings is shown in the next chart, below. Census reported that rents rose in Q1 2023 to a national average of $1,462. This is an all-time high for the Census data series. It should be noted however that the continued high rate of rent growth seen in the Census Bureau data is at odds with reports from other data providers, such as Apartment List, who have observed a declining rate of rent growth in recent months.
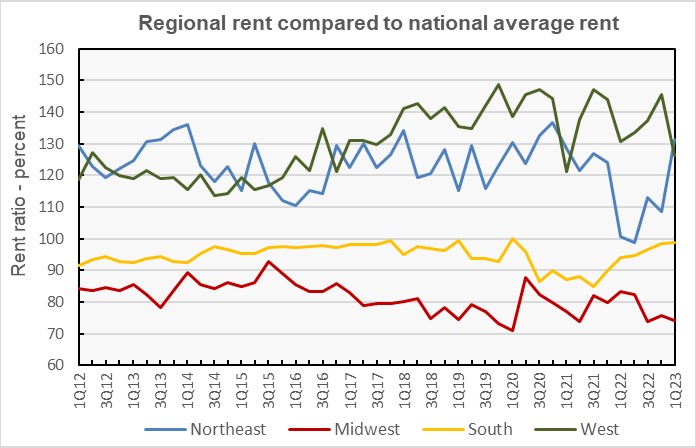
The last chart, below, shows the history of the average rent by Census region as a percentage of the national average rent. Rents in the Northeast as reported by the Census Bureau took a remarkable jump in Q1. Northeast region rents are now again the highest in the country according to Census. Rents in the West fell in absolute terms in Q1, the only region where this was the case. West region rents are now the second highest in the country, 26 percent above the national average. Rents in the South rose at nearly the same rate as did the national average rent while Midwest region rents fell behind the national average increase despite increasing in absolute terms.
The Census report is called Quarterly Residential Vacancies and Homeownership, First Quarter 2023. It is available here.


