

The Census Bureau released its quarterly report on home ownership and occupancy for Q2 2024. It stated that the rental housing vacancy rate was 6.6 percent. This was unchanged for the last year according to the Census Bureau despite the number of renter households reaching a new high.
Looking at vacancy rates
The headline vacancy rate reported by Census is for all rental housing in the country, both single-family and multifamily. Census breaks down this figure in various ways, including by the number of units in the building. The chart, below, illustrates this comparison.
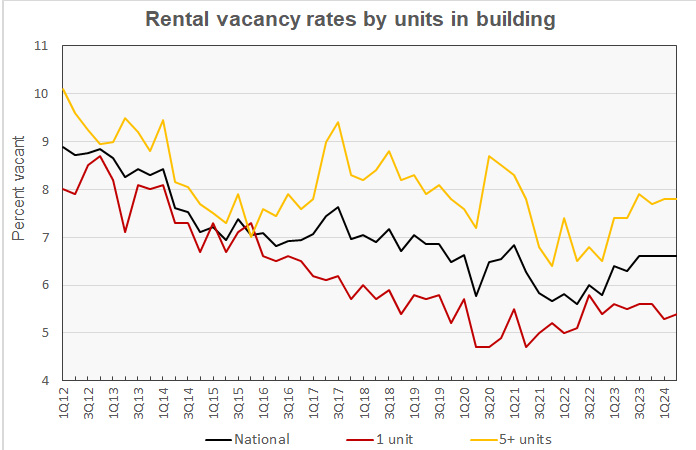
The chart shows that the vacancy rate for multifamily housing with 5 or more units per property as measured by the Census Bureau remained at 7.8 percent in Q2. The single-family rental vacancy rose 0.1 percentage points to 5.4 percent.
Note that Apartment List reported that the multifamily rental vacancy rate at the end of June was 6.7 percent. By contrast, Yardi Matrix reported the multifamily rental vacancy rate in June as 5.5 percent. While the Census Bureau attempts to capture data representative of all rental housing in the country, other data sources may focus on subsets of the market like professionally managed properties and so they come up with different results.
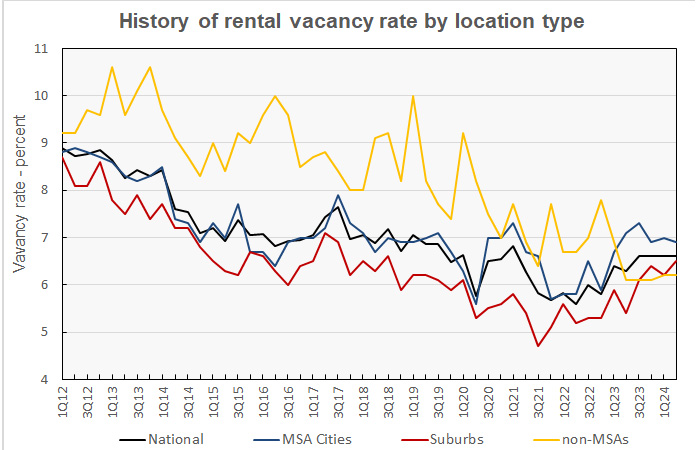
The Census Bureau reported that the rental vacancy rate in the core cities of the Census Bureau’s Metropolitan Statistical Areas (MSAs) was 6.9 percent in Q2 2024, down from 7.0 percent reported for the previous quarter. The rental vacancy rate in the suburbs of the MSAs was 6.5 percent in Q2 2024, up 0.3 percentage points for the quarter. These trends are shown in the next chart, below.
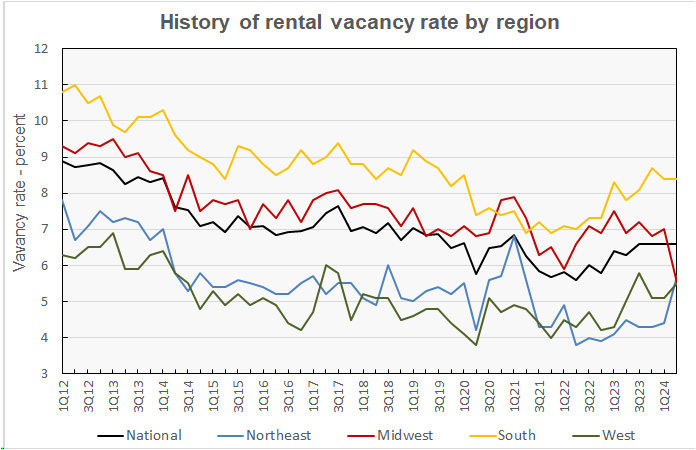
The rental vacancy rate history for each of the Census regions is shown in the next chart, below. The reported vacancy rate jumped 1.3 percentage points higher in the Northeast and 0.4 percentage points in the West. The reported vacancy rate dropped 1.5 percentage points in the Midwest and was unchanged in the South. By the numbers, the vacancy rates were reported to be 5.7 percent in the Northeast, 5.5 percent in the Midwest, 8.4 percent in the South and 5.5 percent in the West.
Census reported that 62.1 percent of vacant rental units were in structures with 2 or more units. About 24.4 percent of the vacant multifamily units had 3 or more bedrooms, with 1 bedroom units comprising 35.0 percent and 2 bedroom units comprising 38.1 percent of vacant stock. The median unit vacancy duration for multifamily properties in Q2 2024 was 2.8 months, up from 2.6 months one year earlier.
Rentership rate unchanged in Q2
The Census Bureau reported that 34.4 percent of the country’s 131,414,000 occupied housing units were inhabited by renter households in Q2 2024. This rate is unchanged from that in Q1 as there was balance in the growth rates of renting and homeowning households in Q2.
The history of the number of occupied housing units and the share of renter households since 2012 is shown in the next chart, below. The chart shows that the reported number of renter households first reached the 44 million mark in the second quarter of 2016 but it did not get to 45 million until last quarter. However, the number of renter households has increased every quarter since Q1 2023, with 1,022,000 renter households added since then. The 45,155,000 renter households found in Q2 2024 set a new all-time high for the fifth quarter in a row.
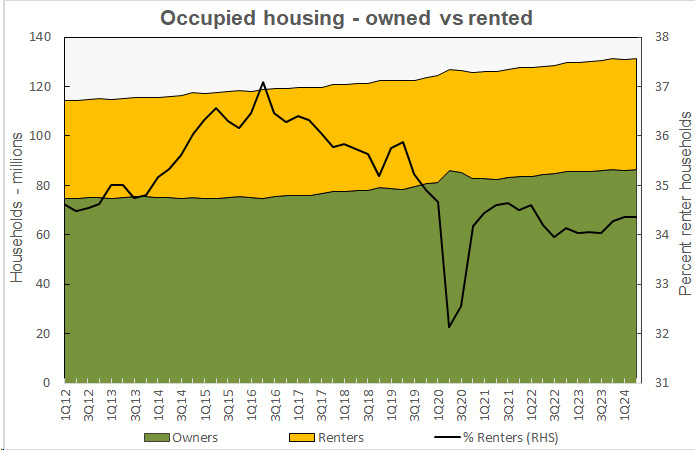
The number of homeowning households rose by 207,000 in the quarter to 86,259,000 households, more than recovering last month’s reported decline. The number of homeowning households surpassed the Q4 2023 figure to also set a new all time high.
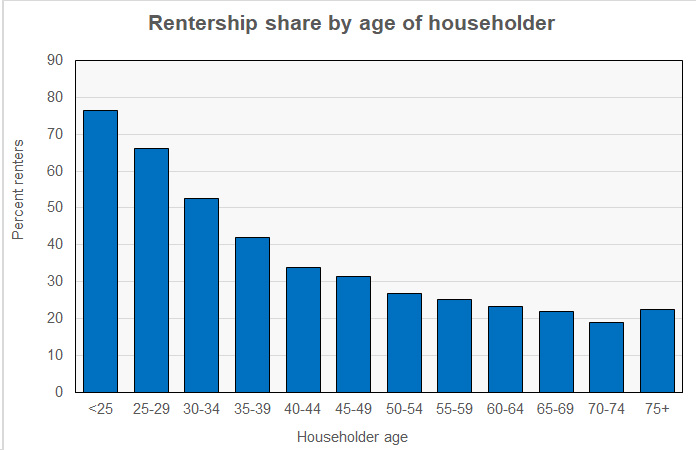
The Census Bureau also reported on the rentership rate by the age of the head of household. The results are illustrated in the next chart. The chart shows that renting is highly age dependent, as every multifamily property manager knows.
Census reports higher rent growth rates
The Census Bureau also tracks the median asking rents for the country as-a-whole. The history of their findings along with the year-over-year rent growth rate is shown in the next chart, below.
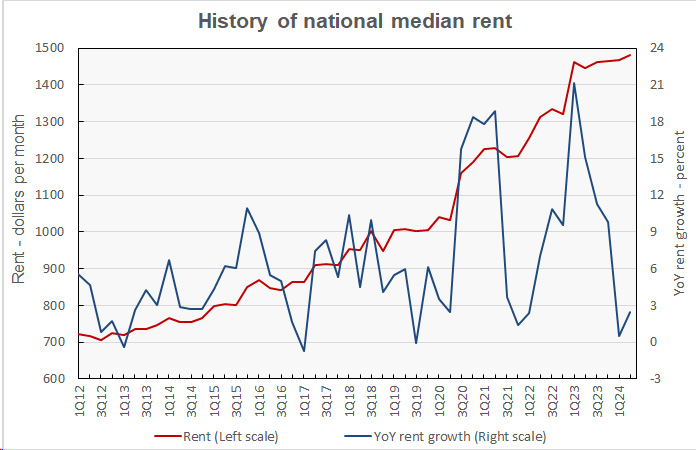
Census reported that monthly rents rose $12 per month in Q2 2024 to another new all-time high. Census reported the national median rent to be $1,481 per month, a gain of 0.8 percent from the prior quarter and 2.5 percent from its level in Q2 2023.
By contrast, Yardi Matrix reported that the national average apartment rent in June was $1,721 per month. Apartment List reported the national average apartment rent in June was $1,411 per month.
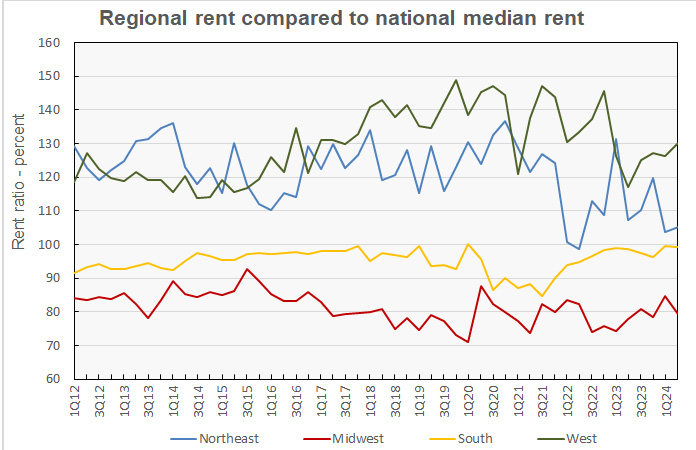
The last chart, below, shows the history of the median rent by Census region as a percentage of the national median rent. Rents were 5.2 percent higher than the national median in the Northeast, and 30.0 percent higher in the West. Rents were reported to be 20.5 percent lower than the national median in the Midwest and 0.6 percent lower in the South.
The Census report is called Quarterly Residential Vacancies and Homeownership, Second Quarter 2024. It is available here.


