

Yardi Matrix reported that the national average asking apartment rent was down $3 in September compared to the revised level of the month before at $1,750 per month. The national average year-over-year asking apartment rent growth was +0.9 percent in September, up 0.1 percentage point from the rate reported last month.
Rents in the “lifestyle” asset class, usually Class A properties, were unchanged year-over-year, while rents in “renter by necessity” (RBN) properties increased by 1.9 percent year-over-year. The lifestyle rent growth is up 0.1 percentage point from last month’s rate while the RBN rent growth is unchanged from last month’s rate. The chart, below, shows the history of the year-over-year rent growth rates for these two asset classes along with the difference between these rates.
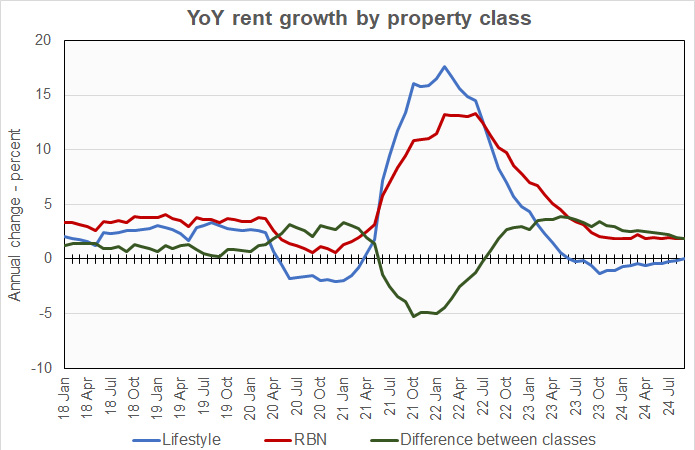
The chart shows that the year-over-year rent growth rate for lifestyle properties reached the breakeven point for the first time since June 2023. It also shows that the rent growth rate for lifestyle properties greatly exceeded that of RBN properties during second year of the pandemic when the economy was awash in excess savings due to multiple rounds of stimulus payments. However, this relationship reversed in August 2022. Since then, RBN rent growth has outpaced that of lifestyle properties, and by a greater degree than was the case in 2018 and 2019.
Yardi Matrix reported that the U.S. average occupancy rate in June was up 10 basis points from the level in last month’s report at 94.8 percent. The occupancy rate was reported to be unchanged year-over-year.
Jobs + immigration = absorption
The discussion portion of the report focused on the boom in apartment demand since the pandemic, with 1.72 million multifamily units being absorbed since March 2020. The national average absorption rate over that time has been nearly 11 percent and none of the 132 markets Yardi Matrix tracks has seen negative absorption. Absorption has been high in regions with high levels of new supply, like the Southeast, but it has been around 10 percent even in regions with lower levels of new supply like the Northeast and Midwest. The pressure this puts on occupancy explains why cities in the Midwest and Northeast are well represented in the table of rent growth leaders below.
Yardi Matrix notes that job growth and immigration rates are expected to slow over the next several years but points out that continued population growth is expected in the 20 to 34 age range and in the retiree population. Both of these are prime renter groups, and this demographic trend should keep apartment demand high for the next 5 years.
Tabulating the data
Yardi Matrix reports on other key rental market metrics in addition to rent growth. These include the year-over-year job growth rate based on the 6 month moving average and the completions over the prior 12 months as a percentage of existing stock. The 10 metros with the largest annual apartment rent increases are listed in the table below, along with the other data.
| City | YoY rent | YoY rent last month |
YoY jobs (6 mo moving avg) |
Completions as % of stock |
| New York | 5.4 | 4.8 | 1.3 | 1.2 |
| Kansas City | 4.2 | 4.1 | 1.4 | 1.8 |
| Boston | 3.4 | 2.9 | 0.6 | 2.5 |
| Indianapolis | 3.3 | 3.0 | 2.1 | 2.7 |
| Washington DC | 3.1 | 3.4 | 0.7 | 2.2 |
| Detroit | 3.0 | 2.0 | 0.2 | 1.0 |
| Columbus | 2.8 | 2.9 | 0.7 | 3.6 |
| New Jersey | 2.8 | 2.9 | 1.4 | 2.7 |
| Chicago | 2.4 | 2.1 | 0.1 | 1.7 |
| Baltimore | 1.9 | 1.4 | (0.2) | 1.1 |
The major metros with the smallest year-over-year apartment rent growth as determined by Yardi Matrix are listed in the next table, below, along with the other data as in the table above.
| City | YoY rent | YoY rent last month |
YoY jobs (6 mo moving avg) |
Completions as % of stock |
| Austin | (4.9) | (5.5) | 2.0 | 7.5 |
| Raleigh | (3.1) | (3.4) | 2.4 | 5.6 |
| Phoenix | (2.4) | (2.9) | 2.3 | 4.1 |
| Tampa | (2.3) | (1.9) | 1.9 | 3.2 |
| Charlotte | (2.1) | (1.9) | 1.6 | 5.4 |
| Atlanta | (2.0) | (2.7) | 1.2 | 4.0 |
| Nashville | (2.0) | (1.7) | 0.6 | 6.0 |
| Orlando | (1.8) | (2.7) | 1.7 | 4.6 |
| Dallas | (1.7) | (1.5) | 1.6 | 3.0 |
| San Diego | (0.8) | (0.5) | 0.8 | 2.0 |
The top metros for month-over month rent growth in September were Indianapolis, New York, Philadelphia and San Francisco. Only Indianapolis was in the top 4 in last month’s report. The trailing metros this month were Seattle, Nashville, Denver and Boston. None of these metros were in the bottom 4 in last month’s report and Boston was in the top 4, showing the volatility of this data.
Single-family rentals also see decline
Yardi Matrix also reported that single-family rental (SFR) rents fell $3 in September from the revised level of the month before to $2,167 per month. The year-over-year SFR rent growth rate fell 0.1 percentage points from the level reported last month to 0.6 percent.
Yardi Matrix reported on the top 34 markets for built-to-rent single family rentals, 16 of which saw rents grow year-over-year in September. The leading markets for year-over-year rent growth were Raleigh, South Dakota, Kansas City and Indianapolis. Once again, none of them saw double-digit rent growth.
The markets with the lowest year-over-year rent growth were Phoenix, Pensacola, Jacksonville, and Tampa.
The national occupancy rate for single-family rentals in August was unchanged from the level of the month before at 95.3 percent.
This month, 12 of the metros saw year-over-year occupancy increases. The metros with the largest year-over-year occupancy increases were Pensacola, Nashville, South Dakota and Salt Lake City. The metros with the greatest occupancy declines were Indianapolis, Jacksonville, Inland Empire and Charlotte.
The complete Yardi Matrix report provides information on some of the smaller multifamily housing markets and more information on the differences in results between lifestyle and RBN properties. It can be found here.


