

The Census Bureau released its quarterly report on home ownership and occupancy. It showed that the rental housing vacancy rate rose from 6.6 percent to 6.8 percent over the past year even as the number of occupied rental housing units rose by 233,000.
A wide view
Unlike other reports that focus on large, professionally managed properties, the census report takes a broad look at the nation’s rental housing, including both single family and multifamily rental housing. The report found that 34.4 percent of the country’s 125,944,000 occupied housing units were inhabited by renter households in Q1 2021. This rate is up 0.2 percent from the year-earlier rate.
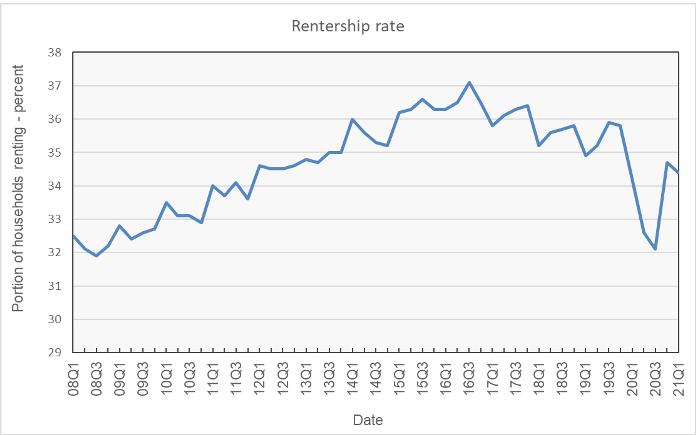
The history of the share of renter households since 2008 is show in the first chart, below. The chart shows that an increasing portion of the population were renters from 2008 until 2016, when a shift to homeownership took place.
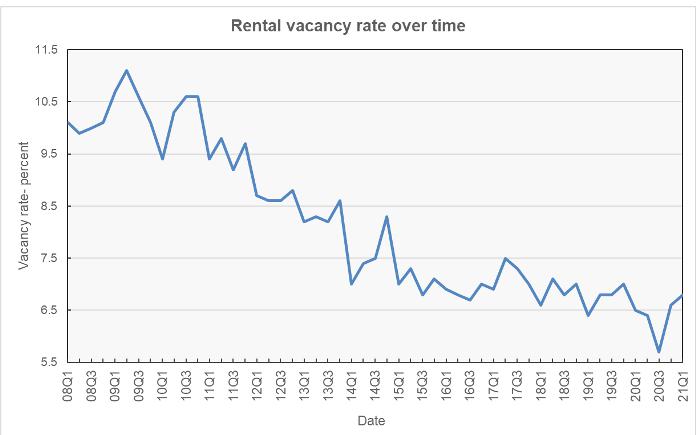
The rental vacancy rate fell between 2008 and 2016 when the share of renter households was rising and it continued to fall after 2016, even when the share of renter households was falling. This is shown in the next chart, below.
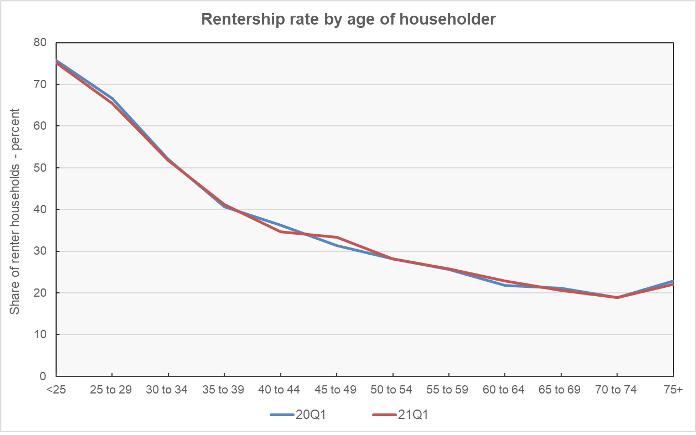
Census also tracked the rentership rate by the demographic characteristics of the head of household. The age of the head of household is a key factor in determining whether the household owns or rents their property. This is shown in the next chart, below.
Leaving the cities
While the rental vacancy rate only rose from 6.6 percent to 6.8 percent over the past year, Census found that the locations of the vacancies shifted. Consider the Metropolitan Statistical Areas (MSAs). These are the regions around large and mid-sized cities. Census looked at the vacancy rates within the core city of the MSA, within the suburbs of the MSA and in areas outside of MSAs, typically small towns or rural regions. Census found that the vacancy rate jumped from 6.4 percent to 7.3 percent in the core city of the MSA, year-over-year. Over the same period, vacancy rates fell from 6.2 percent to 5.8 percent in the suburbs and from 9.1 percent to 7.7 percent in areas outside of the MSAs.
Regional differences
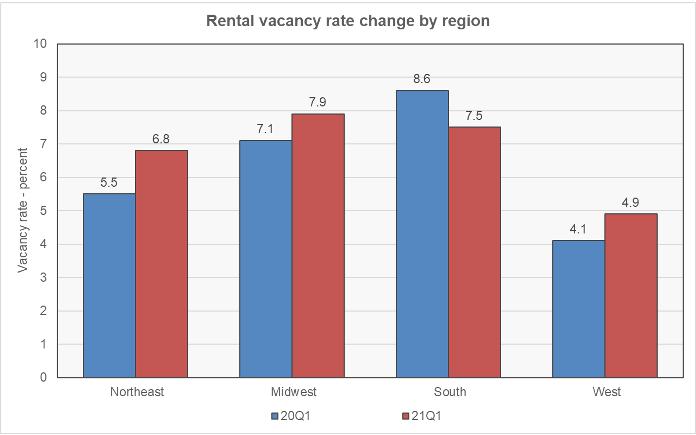
The report also found that vacancy rate changes over the past year affected different regions of the country differently. The Northeast, Midwest and West regions all saw vacancy rates climb, although in the West it was from a very low level. However, the South region saw a significant drop in its vacancy rate, albeit from a high level. These results are show in the next chart, below.
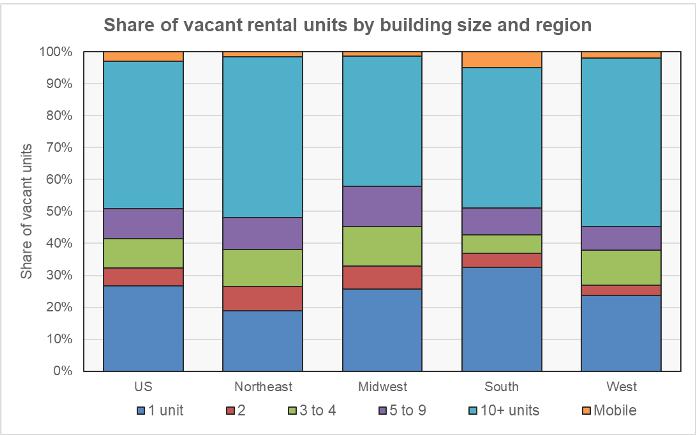
Census reported that there were regional differences in the composition of the vacant rental units. This is shown in the next chart, below. In the Northeast and the West, a higher portion of vacant units are in buildings with 10 or more units than is the case for the nation as-a-whole. In the Midwest, a higher portion of vacant rental units are in buildings with less than 10 units. In the South, single family homes and mobile homes comprise a higher share of vacant rental units than the national average.
Size matters
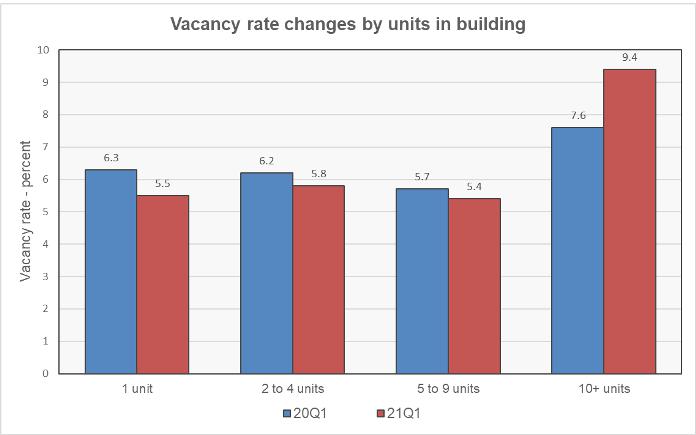
The final chart, below, shows how the vacancy rates have changed over the last year by building size. Vacancy rates have fallen for smaller buildings while they have risen for buildings with more than 10 units. This is another indication of a preference for lower density living resulting from the pandemic.
The Census report is called Quarterly Residential Vacancies and Homeownership, First Quarter 2021. It is available here


