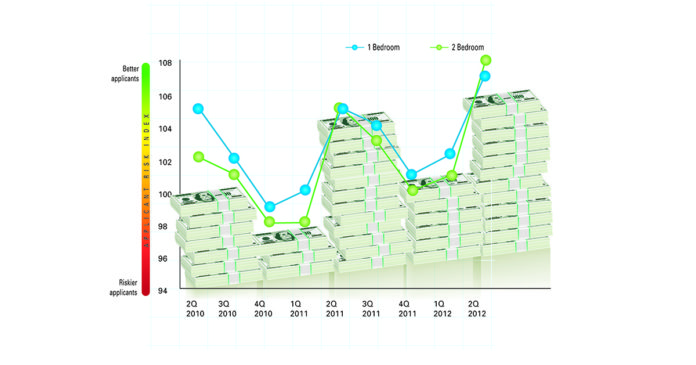
When comparing applicants for one- versus two-bedroom units, the Q2 2012 index is slightly lower for one-bedroom units at 107, with two-bedrooms at 108.
Rent affordability continues to improve as the share of rent paid by applicants is near its lowest level since 2007 for all property classes. As residents “continued doubling up, lower rent-to-income ratios suggest that renters can afford higher rents in many markets for many property types,” according to Jay Harris of CoreLogic SafeRent.
Younger applicants are returning to the markerplace: Applicants, age 18-24, appear to be returning to the market-their share of traffic is up over the past 12 months compared year-over-year. In the second quarter, applicants, age 18-24, were 18.3 percent of applicants to Class A properties, levels not seen since Q3 2008.
Thin or no credit file applicants have increased. Applicants with thin (3 or less trade lines on credit bureau file) or no credit bureau files were 28.9 percent of Q2 applicants- the highest share of renter applicants since 2007.
And while many thought the housing collapse would adversely affect the ability of the this same group to enter the rental market, derogatory mortgage history doesn’t appear to be a barrier for applicants.
After increasing for three consecutive years, the share of rental applicants with prior mortgage history was only slightly higher in Q2; 27.5 percent, compared to the prior year. The share of applicants with derogatory mortgage history was unchanged at 4.9 percent. It is important to note that more than 82 percent of applicants with mortgage history qualify to rent under the SafeRent criteria.
“SafeRent clients are qualifying to rent substantial majorities of consumers who lack a conventional credit file,” adds Harris.
The 18-24 age group appears to be returning to the market. This segment was 18.3 percent of applicants to Class A properties- levels not seen since Q3 2008.
Regional multifamily applicant risk index data
Regionally, the South reflected the lowest index value-105, although this is a four point increase year-over-year. The Northeast continues to maintain the highest index with a value of 116, showing no change.
The three Metropolitan Statistical Areas (MSA) with the greatest decreases in the index year-over-year were Cleveland-Elyria- Mentor, Ohio (2-point decline); Rochester, N.Y. (2-point decline); and Oklahoma City, Okla. (1-point decline).
Those MSAs with the greatest increases were New York-Northern New Jersey-Long Island, N.Y.-N.J.-Penn.; San Diego- Carlsbad-San Marcos, Calif.; and Salt Lake City, Utah; each up four points.


