On November 28, Marcus and Millichap presented their 2019 Multifamily Investment Forecast webinar. It was hosted by John Sebree and John Chang of Marcus and Millichap and featured industry representatives Fred Leeds and Eric Silverman to get their perspectives.
Defining the environment
Marcus and Millichap (M&M) reported that consumer confidence is at an all-time high. This is driving consumption, including consumption of housing. The economy has now achieved 97 months of continuous job creation, which is the longest such period ever in the U.S. However, given that the number of job openings exceeds the number of unemployed people, they expect that the lack of workers will retard employment growth in the future.
Competition for workers is expected to put pressure on wages and could lead to a rise inflation. Annual wage growth has now reached 3 percent in U.S. A positive aspect of this trend is that higher wages will allow people to pay more in rent. This is particularly true for those in workforce housing who are living paycheck to paycheck.
The demographics front
Millennials, the largest generation in U.S. history, are now entering their 20’s and early 30’s. This is a prime age range for renters and this demographic group is supporting the demand for apartments. However, they are also now approaching the typical age of first marriage. As they marry and have children, they will likely migrate from the urban core to the suburbs. This will impact the housing markets in both of those areas.
While the unemployment rate of people between the ages of 20 and 35 has always been higher than that of older workers, the unemployment rate of Millennials has fallen along with that of the workforce as-a-whole. It is now down to 4.5 percent, giving more people in this age range the opportunity to form their own households.
Housing supply and demand
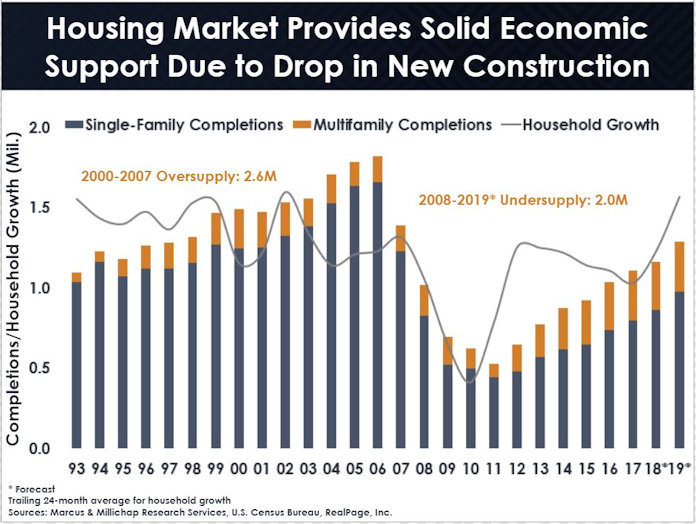
M&M showed an interesting chart on the historical relationship between household formation and new housing supply, reproduced below. It shows that the housing boom of the early 2000’s resulted in an oversupply of housing between 2000 and 2007. However, since the recession, the surge in household formation has caused an undersupply of 2.0 million units. This contributes to today’s tight rental market.
The recent change in the tax law limiting the mortgage interest deduction reduces an incentive to home ownership. Rising interest rates make qualifying for a loan more difficult. Rising construction costs make it impossible for builders to build starter homes. All of these changes may support the growth of the renter population, particularly in the urban core.
While home prices have been rising by 5 percent annually, sales have fallen recently. A factor in this trend is that people who locked in low mortgage interest rates are reluctant to move and finance their new home at a much higher rate. This has reduced the number of homes available for purchase. A consequence of the tight housing market is that the home ownership rate for people under 35 has fallen from a peak of 43 percent in 2007 to 37 percent today.
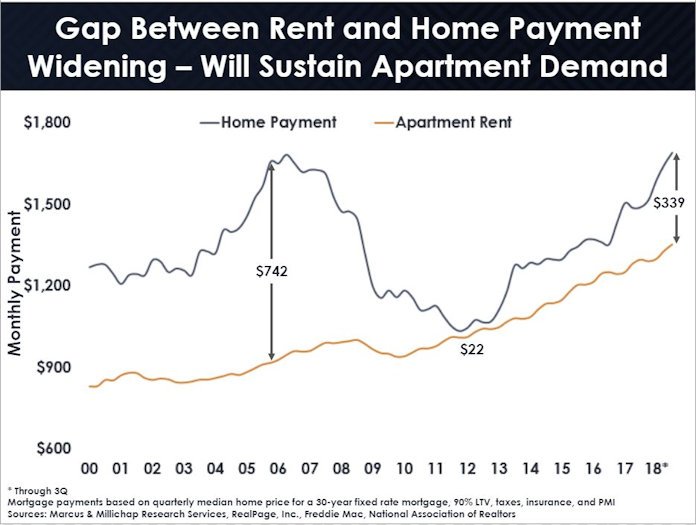
The spread between the cost of the median house payment and renting the median apartment is widening. This is illustrated in the chart reproduced below. M&M expects this gap to continue to grow as interest rates rise. The increasing difficulty of purchasing a home is expected to contribute both to the number of people renting rather than owning and to the ability of landlords to increase rents in the future.
Apartment supply and demand
Apartments have become a higher fraction of the new housing being produced than in the recent past. The strong supply of apartments is similar to the situation in the 1980’s when the baby boomers were entering the housing market. Builders have recently supplied 300,000 multifamily units per year and have increased the number of apartments by 9.1 percent nationally over the past 5 years. M&M expects this build rate to continue in near term with a 1.8 percent being added to the total apartment inventory in 2019.
In spite of the high level of new supply, vacancies rates are hovering around 4.5 percent nationally. Vacancy rates in primary markets are currently the lowest at 4.1 percent. Secondary markets are at 4.5 percent and tertiary markets are at 5.2 percent. Class A product has a vacancy rate of about 5.8 percent while class C (work force) product has a very low vacancy rate of 3.9 percent.
Sales
Total sales transactions are now about 8% higher than the pre-recession peak but have plateaued in the last few years. Capital has flowed into secondary markets, driven by low cap rates in primary markets. This reverses the situation from earlier in the recovery, when primary markets had higher cap rates. The cap rate spread between preferred and tertiary markets is now down to 190 basis points from 370 basis points in 2012. The spread in the average apartment cap rate over the rate for 10 year treasuries is down to 210 basis points
Rate compression is causing some investors to look to move into alternate commercial real estate markets where returns are currently better.
Conclusion
M&M’s multifamily investment forecast calls for continued strong market performance for multifamily in 2019 but investors may have to be more selective in choosing the properties in which to invest.
The webinar can be viewed here.


