The Census Bureau recently released its report on annual housing vacancies. The report looks at vacancies for both units owned as rentals and units owned for owner occupancy. While it does not separate out multifamily and single-family rentals, it gives a high-level view of how tight the market for rental housing is.
Looking at the big picture
The history of the national annualized vacancy rate for units owned as rentals is illustrated in the chart, below. The time period covered by this chart spans the recent recession. The chart shows that the vacancy rate peaked during the downturn and has been on a generally downward course since then, except for the uptick in 2017.
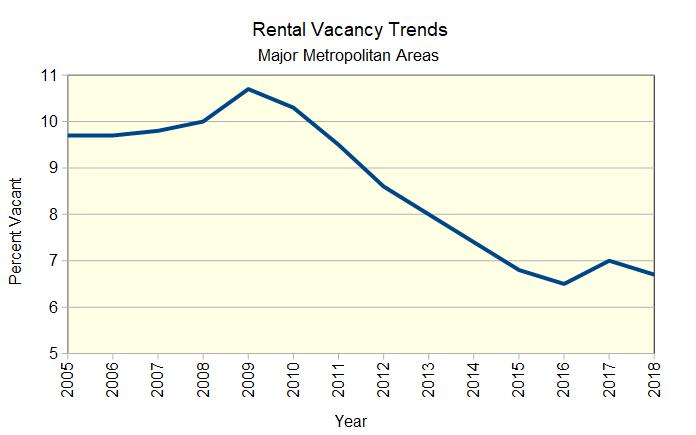
The country-wide rental vacancy rate in the 75 largest Metropolitan Statistical Areas (MSA) was 6.7 percent in 2018, according to the Census Bureau. This is down from the recent high of 10.7 percent measured in 2009, but is still above the recent low of 6.5 percent seen in 2016.
Where things are tight
The national data hides significant variations in rental vacancy rates across the country. In the 75 largest metro areas covered by the report, the vacancy rate ranges from a low of 1.8 percent in Fresno, Calif., to a high of 17.9 percent in Charleston, S.C.
The MSAs with the lowest rental vacancy rates are Fresno (1.8 percent), Worchester, Mass. (2.6 percent), Akron, Ohio (3.3 percent), Boston, Mass. (3.8 percent) and Denver, Colo. (3.8 percent).
Both Fresno and Akron have seen significant declines in recent years. In 2015, the vacancy rate in Fresno was 5.6 percent. The 2018 vacancy rate is down by two-thirds since then. In 2015, the vacancy rate in Akron was 11.8 percent, so it has dropped by 8.5 percentage points since then. This is the largest drop of any of the 75 MSAs covered by the report.
And where things are not
At the other end of the scale, the MSAs with the highest rental vacancy rates are Charleston, S.C. (17.9 percent), Toledo, Ohio (12.6 percent), Birmingham, Ala. (11.9 percent), Oklahoma City, Okla. (11.8 percent) and Memphis, Tenn. (11.7 percent).
In addition to having the highest vacancy rate, Charleston saw the largest jump in rental vacancy rates since 2015 of any of the MSAs measured. Its vacancy rate nearly doubled from 8.7 percent in the three years after 2015, rising 8.3 percentage points. The city that saw the next-highest jump in its vacancy rate was Albany, N.Y., where the vacancy rate increased 4.3 percentage points from 6.5 percent in 2015 to 10.8 percent in 2018.
Remarkably, while Birmingham came in with the third highest vacancy rate in 2018, it also came in with the second highest decline in vacancy percentage since 2015 of the 75 MSAs measured. In 2015, its vacancy rate was 17.7 percent, over 2 ½ times the national rate at the time. Its vacancy rate decline of 5.8 percentage points in the next 3 years was second to only Akron’s.
Most of the data in the Census report is presented in the form of Excel spreadsheets. They can be found here.


