

The latest Census Bureau report on housing vacancies shows that the rental housing vacancy rate in Q4 2020 was 6.5 percent, only 0.1 percent higher than the year-earlier rate.
Big picture view
The Census Bureau report on rental housing includes all rental housing, both single-family and multifamily. Taking both occupied and unoccupied rental units together, the report covers about 46 million housing units.
The trend for the rental housing vacancy rate over the last four years is shown in the first chart, below. The chart shows that the rate has been on a downward path. This is part of a long-term trend that has been in place since the end of the previous recession in 2009 when the rental housing vacancy rate peaked at around 11 percent.
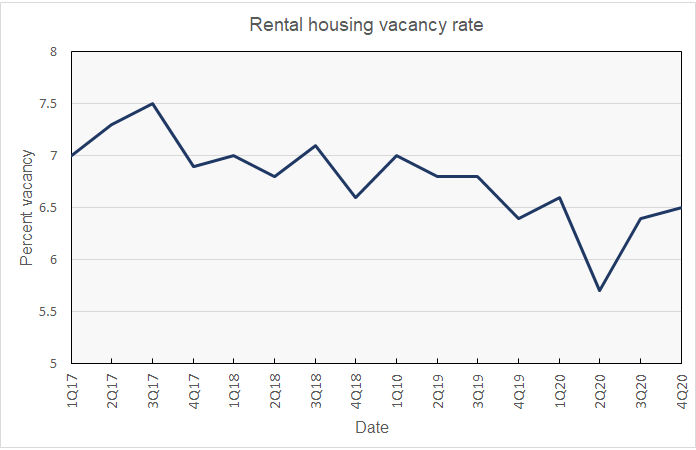
While the rental housing vacancy rate reported for Q4 2020 is 0.1 percent higher than that reported for Q4 2019, it is interesting to note that the rise in the rate is due more to a fall in the number of rental housing units than due to an increase in the number of units that are vacant. Census reported that the total number of occupied and unoccupied rental housing units fell by 275,000 from year-earlier levels while the number of unoccupied rental housing units rose by only 3,000.
Leaving the cities?
The Census Bureau provides a few alternate views into the vacancy data. One is by reporting the vacancy rates in three different types of regions. These are: within the principal cities of metropolitan statistical areas (MSAs), in the suburban regions of MSAs, and in areas outside of MSAs. There are 384 MSAs in the United States, with the smallest being Carson City, Nevada, with a population of under 60,000. The vacancy rates by the type of region are shown in the next chart, below.
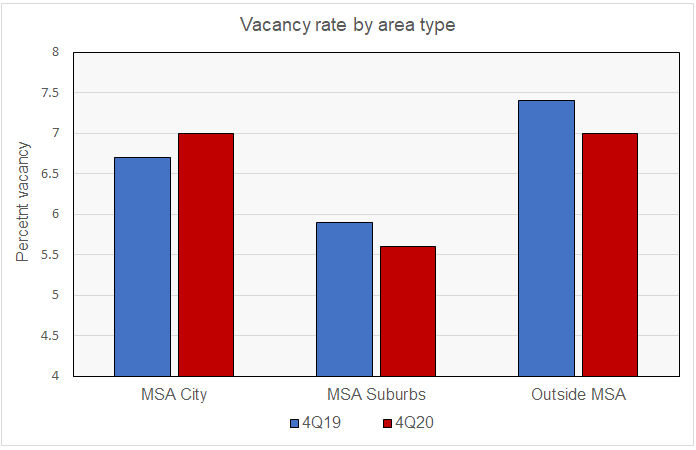
The chart shows that the rental housing vacancy rate has risen over the last year in the principal cities of the MSAs, while it has fallen in the both the suburbs and in the more rural areas. This supports the notion that renters are leaving the high-density urban core for lower density alternatives.
The rise in vacancies in the principal cities from 6.7 percent in Q4 2019 to 7.0 percent in Q4 2020 may not seem dramatic. However, while the major cities like New York, Los Angeles and San Francisco that have been reported to be suffering a significant loss in renter population are included in this category, so are many smaller cities which may have gained renters. The effect of including such a wide range of cities in this grouping is to balance out changes and to reduce the sharpness of the change in results.
Regional variations
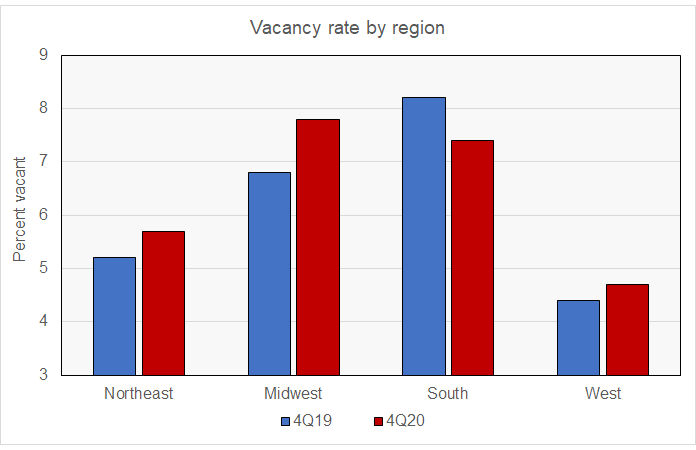
The Census Bureau also reported the vacancy rate by region of the country. These results are shown in the next chart, below. The chart shows that the rental housing vacancy rate rose for the year in all regions of the country except for the South. It is remarkable that the vacancy rate fell in the South as the South leads in delivery of new units.
A word on pricing
Census reported that the median asking rent in Q4 2020 was $1,190 per unit. This is up from a median asking rent of $1,005 reported in Q4 2019, an 18 percent jump in a year. While asking rents are not contracted rents or effective rents after concessions, the size of this jump is both remarkably high and also inconsistent with other reports. The explanation for this may be in the final chart below. The chart shows the distribution of units being offered for rent by the asking rent.
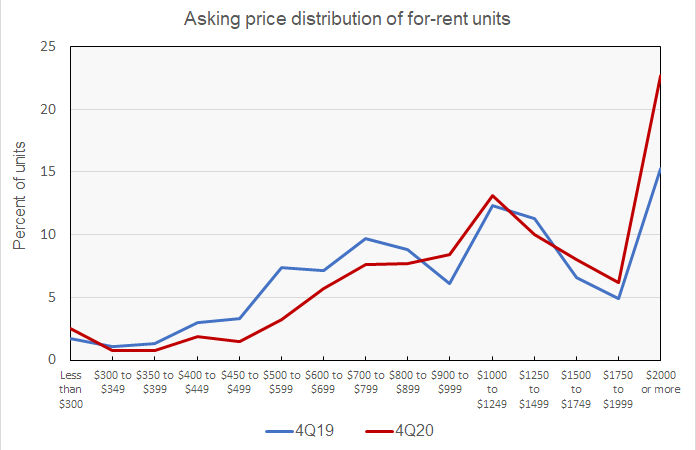 Compared to a year ago, the portion of low-priced rental units being offered is down while the portion of rental units being offered in the highest price ranges is up. These differences skew the average upward. That is why it is important to track rent changes on the basis of changes in effective rents on the same unit. This method eliminates the distortion of the results caused by a change in the mix of units being surveyed.
The rental vacancy report is issued quarterly. The next report will be released in late April.


