

The Bureau of Labor Statistics (BLS) recently released the Job Openings and Labor Turnover (JOLT) report for February. It shows that the labor market took a step back in that month.
Looking at the churn
The US labor market is dynamic with many people changing jobs in any given month. The JOLT report documents this dynamism by providing details about job openings, hiring and separations. However, it does not break down the jobs market into as fine categories as does the Employment Situation Report, which provides data on total employment and unemployment. For example, while the Employment Situation Report separates residential construction from other construction, the JOLT report does not. The Employment Situation Report separates residential property managers from other types of real estate and rental and leasing professionals but the JOLT report does not. However, the JOLT report provides a look at what is driving the employment gains (or losses) in these broader employment categories.
Construction jobs decline
The first chart, below, shows the employment situation for the construction jobs market over the last 25 months. The chart shows the huge surge in separations in March and April of 2020 as the COVID inspired lockdowns swept through the economy. Hiring jumped in May as construction restarted in many areas of the country. Job growth remained positive over the next 8 months with employment gains nearly making up for the job losses from March and April. However, job growth turned negative in February as hiring remained steady but separations increased.
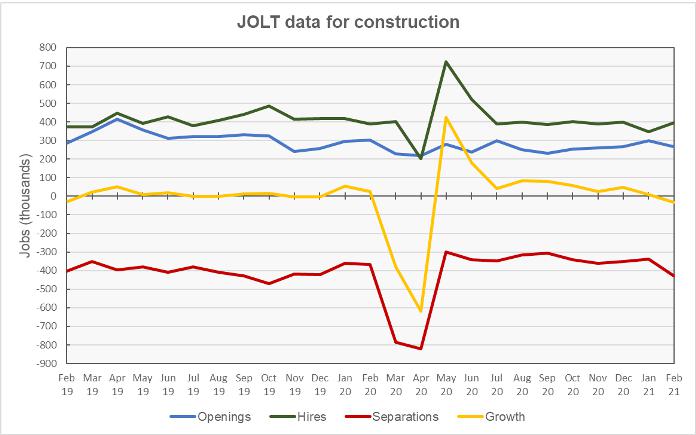
Separations can be involuntary (layoffs), voluntary (quits) or other (retirements and transfers). Usually, layoffs comprise around 50 percent of construction separations. In April 2020, layoffs were 87 percent of separations.
In February, layoffs from construction jobs were 35 percent higher than their trailing 6-month average, at 250,000 on a seasonally adjusted, annualized basis. Quits were also up, rising 17 percent above their trailing 6-month average. Total separations were up 27 percent from their trailing 6-month average at 428,000. Meanwhile, hiring was flat at 396,000 people, resulting in a loss in construction employment for the month.
RERL also loses jobs
The second chart, below, shows the employment situation for the real estate and rental and leasing (RERL) jobs category. The chart shows that employment in this category did not recover nearly as well from the March-April job losses as did the construction jobs category. In fact, as of January 2021, 35 percent of the jobs lost in the RERL category had not been recovered, compared to only 5 percent of the construction jobs.
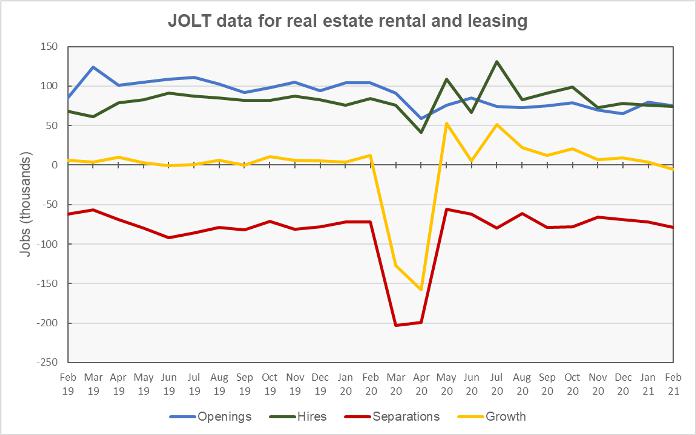
The RERL category lost jobs in February. However, in this case, the loss was caused not only by an increase in separations, but also by a reduction in the number of hires during the month. Separations were up 12 percent from their trailing 6-month average while hires were down 11 percent from their trailing 6-month average.
The rise in separations was caused by a jump in the number of employees quitting their jobs. Quits were 45 percent above their trailing 6-month average while layoffs were 23 percent below their trailing 6-month average. Layoffs represented only 25 percent of separations for the month. The relatively high number of quits may indicate that employees are gaining confidence to seek new opportunities as other organizations staff up to handle the spring and summer “leasing season”.
The numbers given in the JOLT report are seasonally adjusted and are subject to revision. It is common for small adjustments to be made in subsequent reports, particularly to the data for the most recent month. The full current JOLT report can be found here.


