

A report from Real Capital Analytics (RCA) said that multifamily property prices rose 10.1 percent in the year to May as part of a general rise in commercial real estate prices. This represented the largest year-over-year increase in multifamily property prices since March 2020.
Defining the index
Real Capital Analytics tracks an index they call the Commercial Property Price Index (CPPI). The index is computed based on the resale prices of properties whose earlier sales prices and sales dates are known. The index represents the relative change in the price of property over time rather than its absolute price.
Prices rise in May
In addition to the 10.1 percent price gain on a year-over-year basis, RCA reported that multifamily property prices in May were up 1.2 percent for the month. This compares to a 0.8 percent monthly and an 8.9 percent annual price increase for all commercial property types taken together.
Multifamily had the highest price appreciation of the four commercial property types tracked by RCA. The recent leader in price appreciation, industrial properties, recorded a 9.5 percent price gain over the past 12 months. Office buildings within central business districts were again the worst performing sector with a price decline of 5.5 percent over the year. However, pricing strength for suburban offices caused prices to rise 2.9 percent year-over-year for all office buildings considered as a single asset class.
The long and the short of it
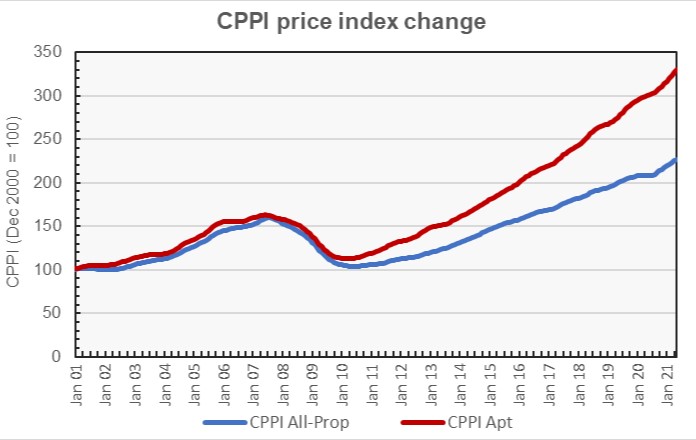
The first chart, below, plots the long-term changes in the RCA CPPI for multifamily properties and for all commercial property as a single asset class. It shows that multifamily property prices tracked those of other commercial property types until 2009. However, multifamily property prices have been consistently increasing at a faster rate since then.
The second chart, below, takes the same data but plots it as the month-over-month change in the values of the indices. It also looks at a smaller time-period so that recent pricing trends are easier to see. The general pattern is for the rate of increase in apartment prices to reach a low point in the winter, often around January. The rate of price appreciation then rises through the spring and summer before declining again.
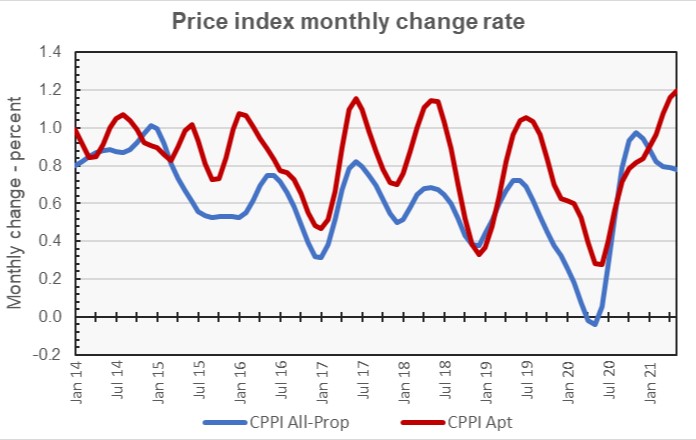
The year 2020 broke from that trend as the rate of price appreciation fell through the spring and summer. However, multifamily property prices overall did not fall. This was not the case for all commercial property as-a-whole, whose price growth turned negative in April and May of 2020.
It is interesting that the other year within the time range of this chart that broke from the usual trend is 2016. It is possible that the pricing softness for commercial property during the summer of that year was driven by the uncertainty surrounding the presidential election which took place that fall.
Major metros trail
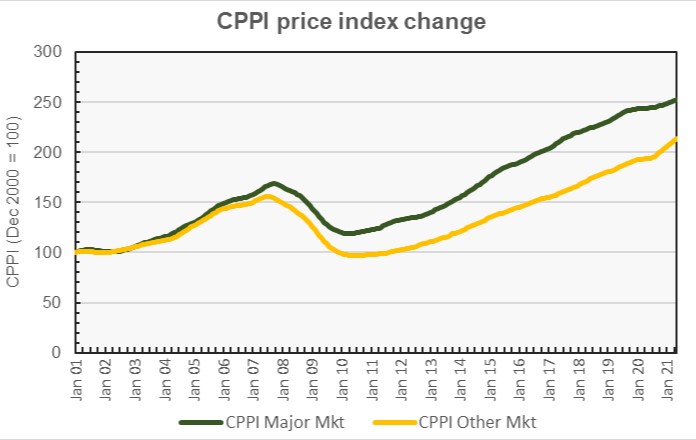
The RCA report provides data comparing the price changes of commercial property in 6 major metro areas* against those in the rest of the country. It does not separate out apartments from other commercial property types in this comparison. The next chart, below, shows the long-term pricing trends for the major markets and for other markets tracked by RCA. Pricing for the two sets of markets diverged after 2006, although the chart shows some convergence recently.
The last chart, below, shows the monthly rate of price appreciation for the two different groups of metro areas since 2014. The chart shows how much stronger has been the recent price appreciation for commercial property in RCA’s non-major markets than it has been in RCA’s major markets.
One thing to note from the chart is that major market price appreciation has lagged for most of the period since July 2017; this is not just a COVID phenomenon. The other thing to note is that the rates of price appreciation for the two sets of metro areas have recently been converging.
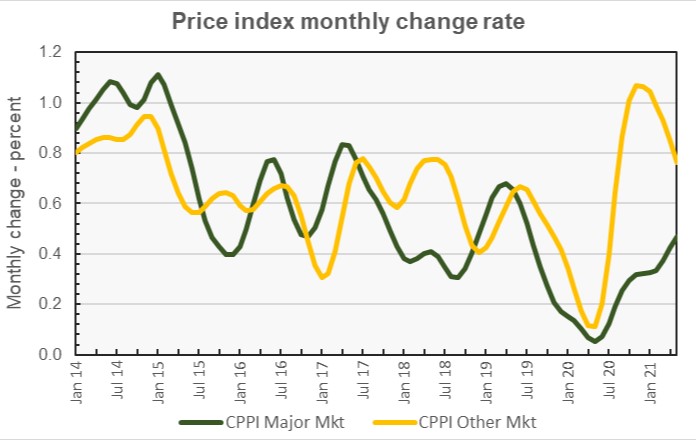
By the numbers, price appreciation for commercial property in major markets was reported to be 0.5 percent for the month and 3.6 percent for the year. Price appreciation for commercial property in non-major markets was reported to be 0.8 percent for the month and 10.3 percent for the year
The full report provides more detail on other commercial property types. Access to the RCA report can be obtained here.
*The major metros are Boston, Chicago, Los Angeles, New York, San Francisco and Washington DC.


