

A report from Real Capital Analytics (RCA) said that multifamily property prices rose 13.5 percent in the year to July, topping the 12 percent annual increase logged last month. Apartments were again the commercial real estate property class with the highest rates of monthly and annual price appreciation in July.
Defining the index
Real Capital Analytics tracks an index they call the Commercial Property Price Index (CPPI). The index is computed based on the resale prices of properties whose earlier sales prices and sales dates are known. The index represents the relative change in the price of property over time rather than its absolute price. Note that, as properties are added to the RCA dataset, each month RCA recalculates the CPPI all the way back to the beginning of the data series.
Prices on the rise
In addition to the 13.5 percent rate of price growth over the prior 12 months, RCA reported that multifamily property prices were up 1.6 percent for the month of July. This compares to a 1.2 percent monthly and an 11.9 percent annual price increase for all commercial property types when considered as a single asset class.
Price appreciation for industrial properties was 1.1 percent for the month and 11.8 percent over the past 12 months. Office buildings within central business districts (CBDs) were again the worst performing sector with price declines of 0.1 percent for the month and 4.6 percent over the prior 12 months. However, all offices as a single asset class experienced price growth of 8.8 percent for the year while retail properties saw their prices rise by 7.5 percent since July 2020.
Tracking price appreciation
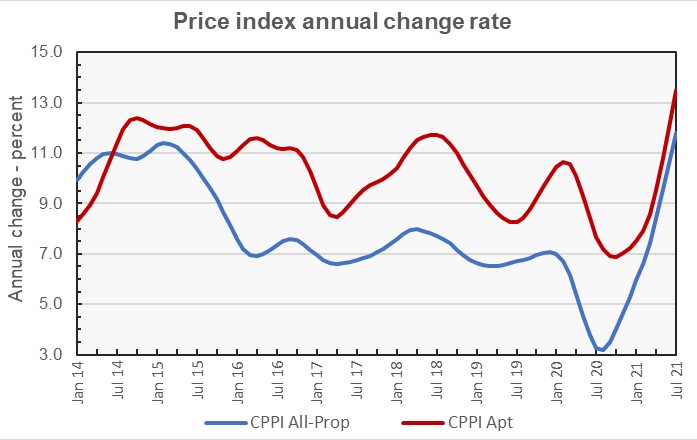
The first chart, below, plots the year-over-year change in the values of the CPPI for all commercial property as a single asset class and for apartments. It shows that the rates of price appreciation for these asset classes fell last summer during the height of the pandemic but that they have accelerated recently.
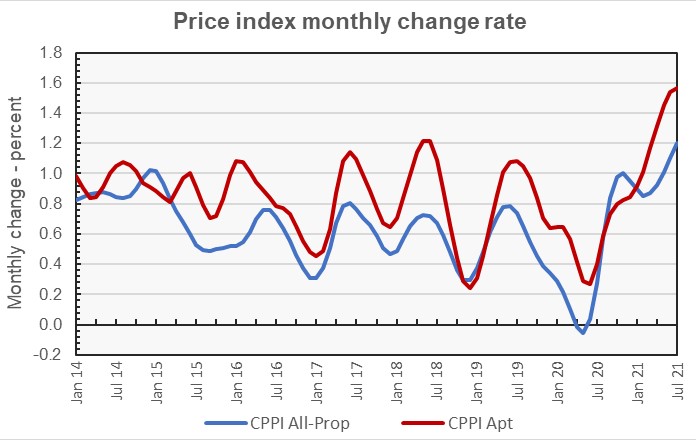
The next chart takes another look at the data, this time focusing on the monthly rate of property price changes. This chart shows a pattern in the data where the rate of price appreciation is generally highest in the summer and lowest in the winter. While there are other departures from this general pattern, the drop in price appreciation last summer was an exceptionally large deviation. However, the high rates of monthly price appreciation in recent months have more than made up for last summer’s drop.
Major metros stand out
The RCA report provides data comparing the price changes of commercial property in 6 major metro areas* against those in the rest of the country, although it does not separate out apartments from other commercial property types in this comparison. The last chart, below, looks at the data based on the rate of price increases over the prior 12 months.
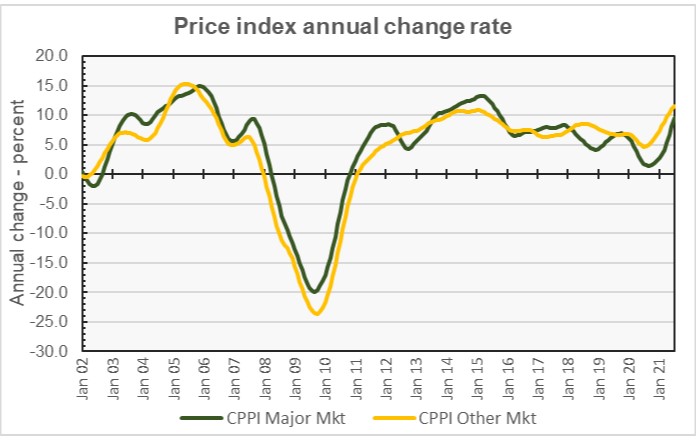
The chart shows that the major markets consistently outperformed the rest of the country from late 2005 until the middle of 2012. Since March 2018, the annual rate of price appreciation for the major markets exceeded that for the rest of the country in only 3 months in the fall of 2019. However, price appreciation in the major markets has been strong recently as detailed below.
By the numbers, price appreciation for commercial property in major markets was reported to be 1.5 percent for the month and 9.6 percent for the year. Price appreciation for commercial property in non-major markets was reported to be 0.9 percent for the month and 11.5 percent for the year
The full report provides more detail on other commercial property types. Access to the RCA report can be obtained here.
*The major metros are Boston, Chicago, Los Angeles, New York, San Francisco and Washington DC.


